Figures & data
Figure 1. Schematic and dimensions of simulated single-nozzle impactor.
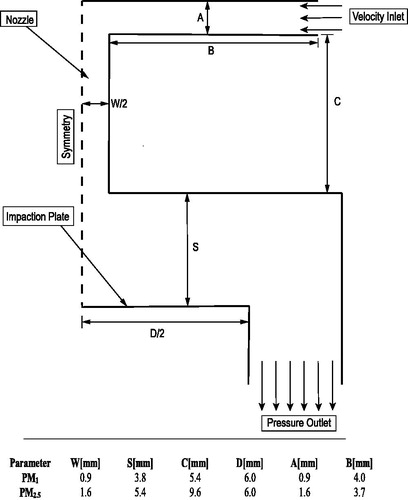
Figure 2. Validation of current simulation results with numerical and experimental results of (Kim et al. Citation2014) for PM1 and PM2.5 impactors.
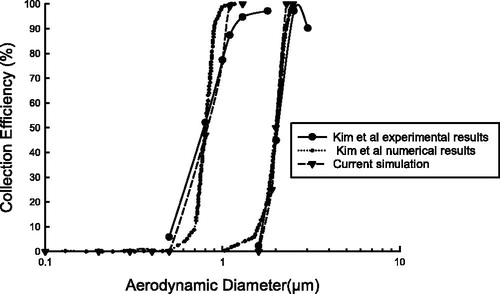
Figure 3. Schematic diagram and dimensions of (a) the simulated section of multi-nozzle impactor and (b) plus a cross section view of the simulated section.
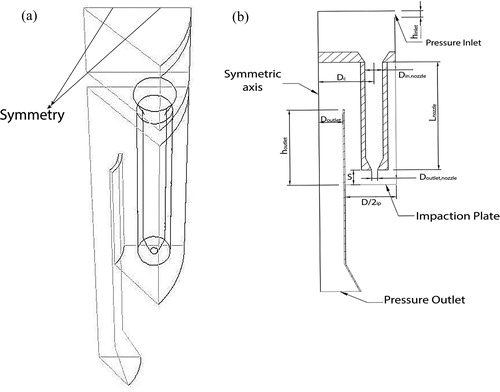
Figure 4. (a) A general and (b) a detailed schematic of experimental package.
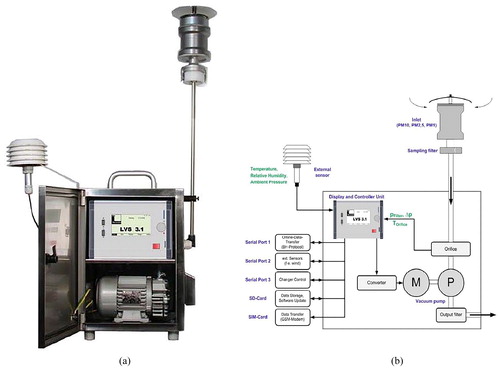
Figure 5. The image of impactor (a) inlet and nozzles and (b) impaction plate and outlet.
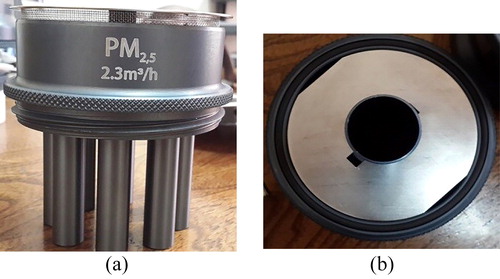
Figure 6. Results of (a) streamlines colored by velocity magnitude and (b) volume rendering colored by velocity magnitude.
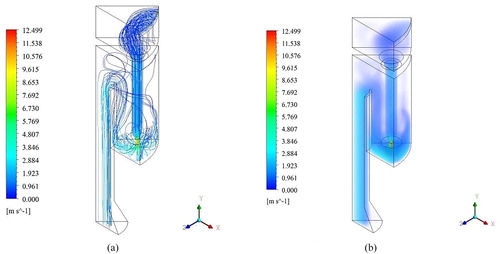
Figure 7. (a) Velocity vectors on impaction plate and (b) velocity magnitude contours on impaction plate.
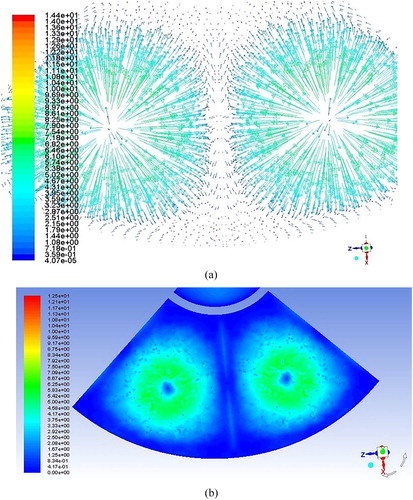
Figure 8. Collection efficiency curve for non-spherical particles with variable shape factors.
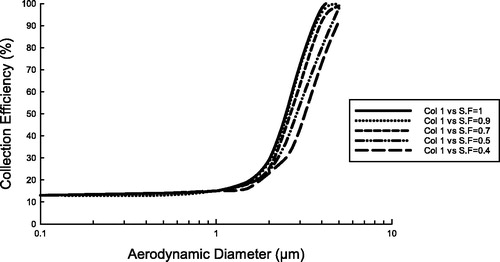
Figure 9. The location of the nozzle center and the boundaries of the simulated area of impaction plate.
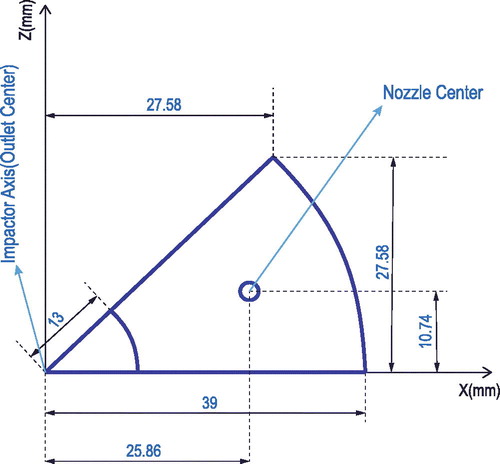
Figure 10. Position of deposited particles with different aerodynamic diameters and shape factors on impaction plate (a) Da = 2.5, S.F = 1; (b) Da = 5, S.F = 1; (c) Da = 2.5, S.F = 0.5; (d) Da = 5, S.F = 0.5; (e) Da = 2.5, S.F = 0.3; (f) Da = 5, S.F = 0.3.
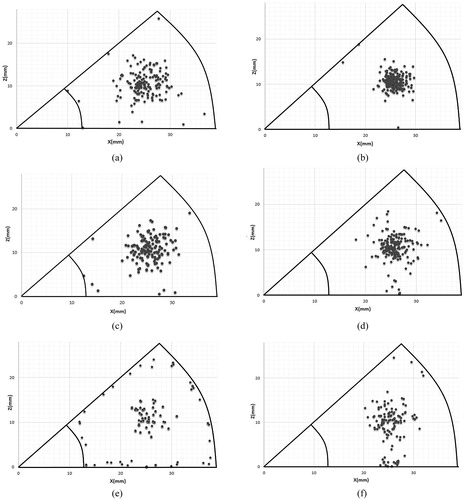
Figure 11. Comparison of the deposition location of particles with a diameter of 2.5 µm and 5 µm.
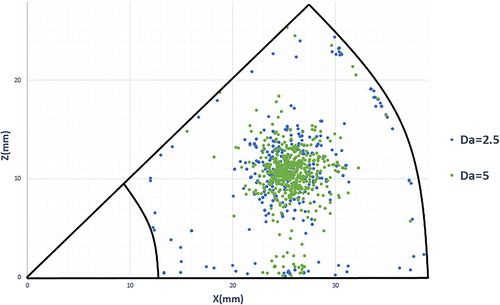
Figure 12. Correspondence of experimental sample and numerical simulation results for the location of defined stagnation points created between two adjacent jets and where the jets hit impaction plate.
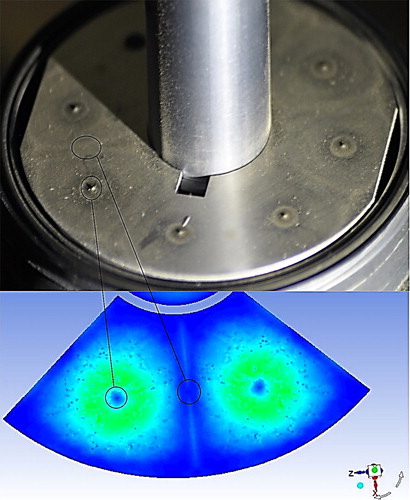
Figure 13. Comparison of the results of numerical simulations and experimental samples for the linear deposition between two adjacent jets and at the edge of impaction plate.
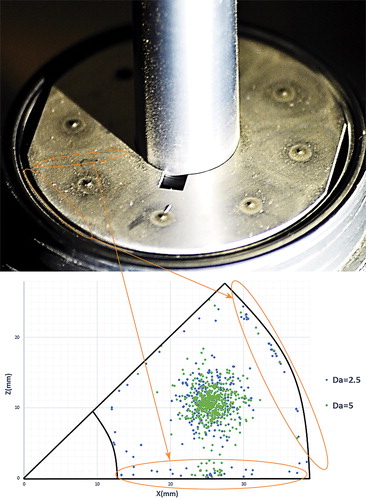
Figure 14. Correspondence between experimental sample and the velocity magnitude contour for the location of linear low-deposited areas surrounded by linear depositions.
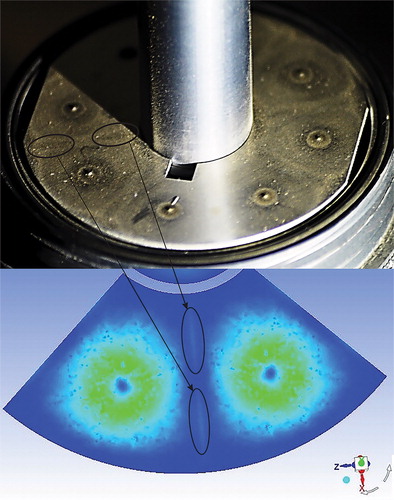
Figure 15. Comparison of numerical simulation results and the experimental samples for primary deposition and low-cumulative deposition between two jets.
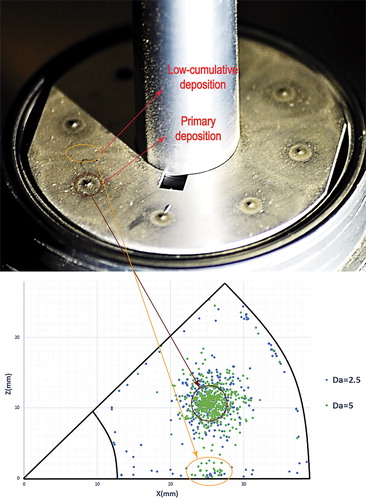
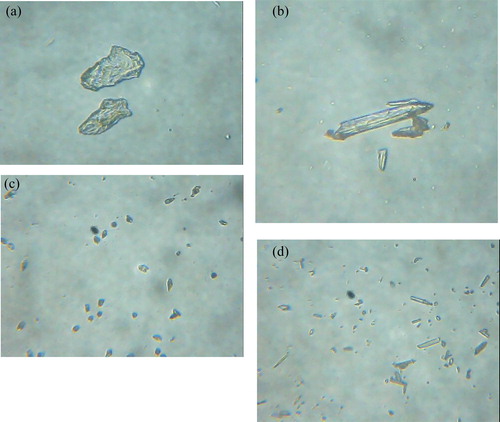
Figure 16. Magnified images of particles related to different areas of deposition. (a) Central area of primary deposition. (b) Low-cumulative deposition between adjacent jets. (c) Outer area of primary deposition. (d) Linear deposition between adjacent jets.