Figures & data
Table 1. Manufacturing parameters of fiber.
Figure 1. Schematic diagram of electrospinning elements.
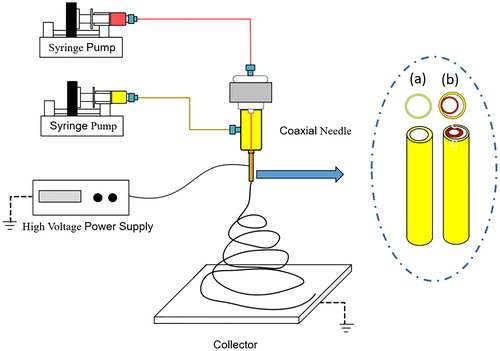
Figure 2. Distribution of particles input of filter.
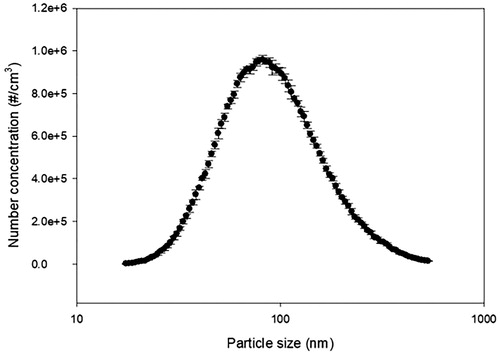
Figure 3. Schematic diagram of filtration and measurement.
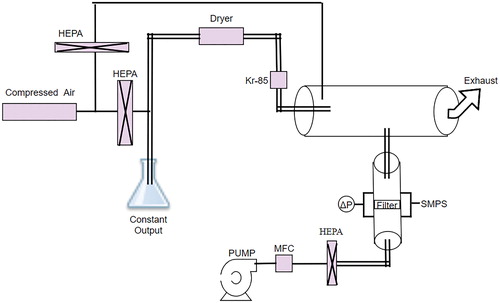
Figure 4. SEM image of smooth fibers.
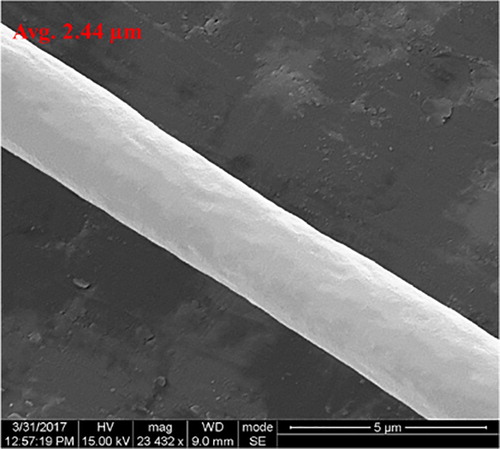
Figure 5. Notched fibers (a) SEM, and (b) pore distribution.
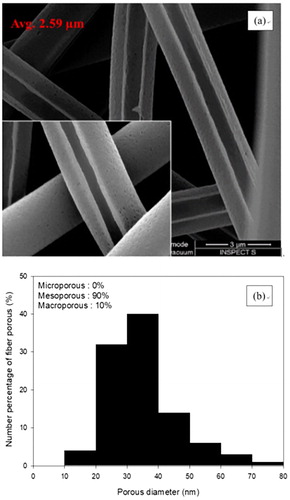
Table 2. Property table of smooth fiber filter with diameter of 2.44 µm.
Table 3. Property table of notched-fiber filter with diameter of 2.59 µm.
Figure 6. The pressure drop of filters at thicknesses of (a) 0.1 mm, (b) 0.14 mm, and (c) 0.19 mm.
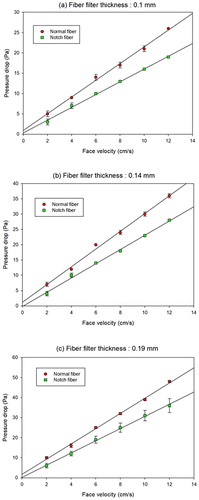
Table 4. The surface potential of 0.19 mm filter thickness.
Figure 7. Penetration of uncharged filters (a) 0.1 mm, (b) 0.14 mm, and (c) 0.19 mm.
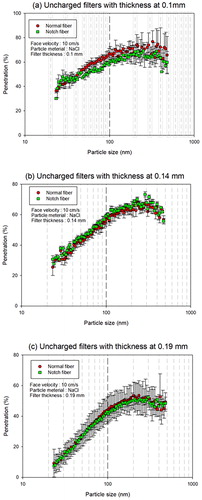
Figure 8. Penetration rate of charged filters (a) 0.1 mm, (b) 0.14 mm, and (c) 0.19 mm.
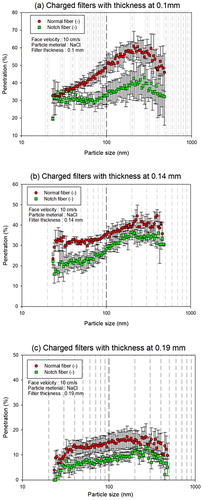
Table 5. The most penetrating particle size (MPPS) offset table for notched porous fibers (units: nm).
Figure 9. Filtration quality of filters: (a) average quality factor of uncharged filters; (b) average quality factor of Charged filters.
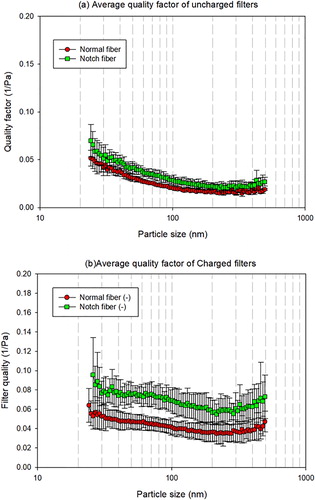
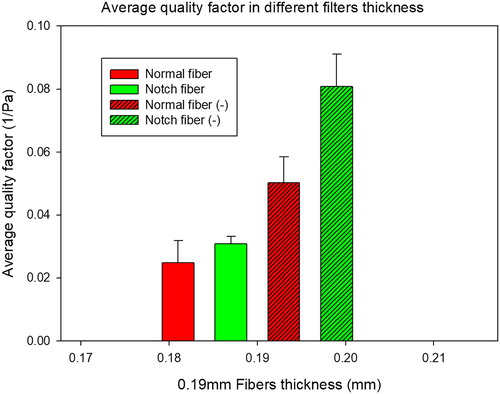
Figure 10. Average quality factor of filters of different thicknesses.