Figures & data
Figure 1. Schematic of the measurement flow path of the prototype instrument, with three lines of measurement: a scanning mobility particle sizer (SMPS), a nanoparticle surface area monitor (NSAM), and a condensation particle counter (CPC). DMA denotes differential mobility analyzer.
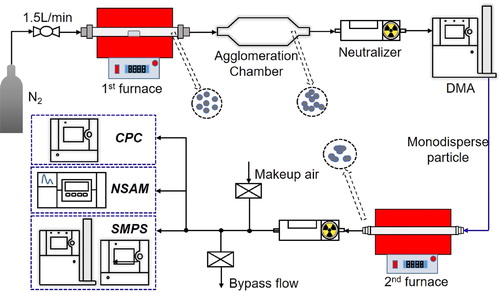
Figure 2. Schematic of the mass calibration procedure of single agglomerates and aggregates.
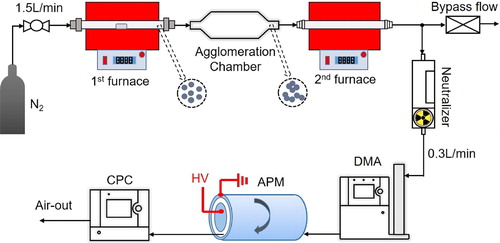
Figure 3. Schematic of instrument sensitivity calibration.
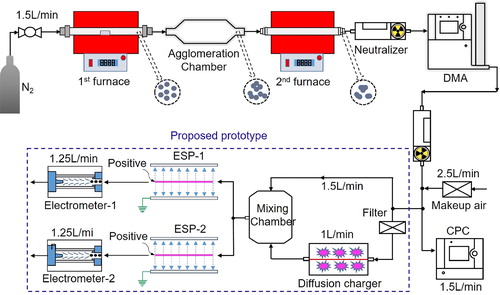
Figure 4. Effects of sintering temperature on (a) mobility diameter and (b) instrument sensitivity of monodisperse agglomerates resulting from charged agglomerates.
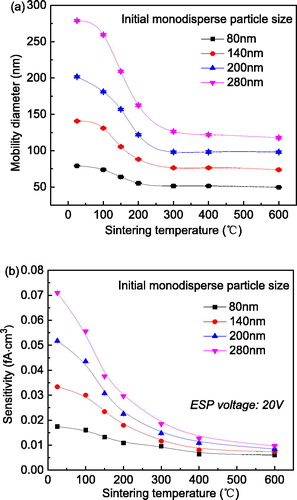
Figure 5. Volume of a single particle for different sintering temperatures and mobility sizes.
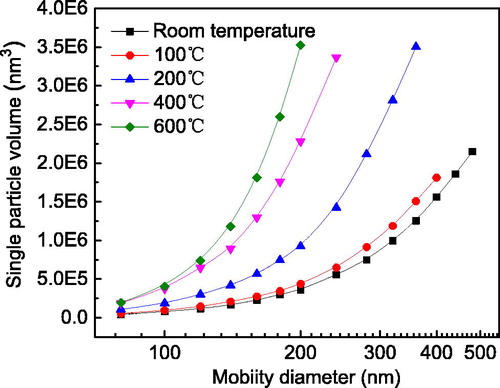
Figure 6. Equivalent primary particle diameter of a single particle at various sintering temperatures and mobility sizes.
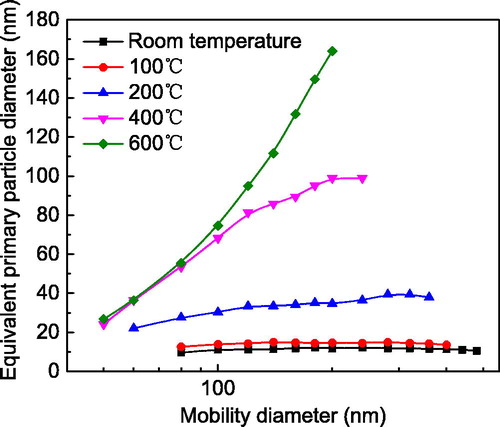
Figure 7. Theoretical surface areas of a single particle at different sintering temperatures and mobility sizes.
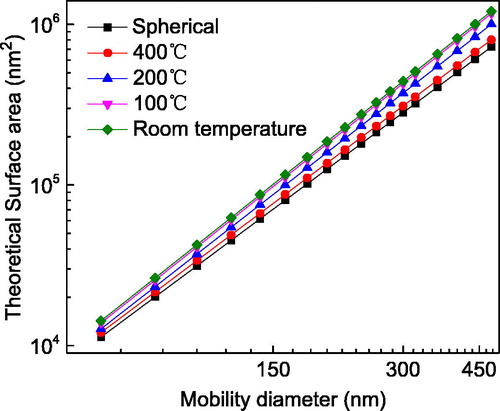
Figure 8. Three-dimensional plot of instrument sensitivity at different voltages of the second electrostatic precipitator and various mobility sizes. (a) Particles prepared at room temperature (agglomerates) and (b) sintered at 400 °C (aggregates).
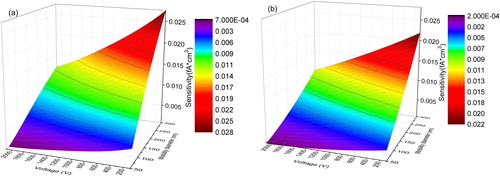
Figure 9. Comparisons of fitted values for particle volumes and geometric surface areas (GSAs) with theoretical values from Eggersdorfer et al. (Citation2012). Results for particles (a) prepared at room temperature (agglomerates) and (b) sintered at 400 °C (aggregates).
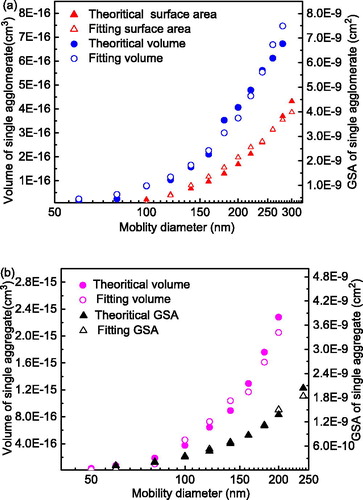
Figure 10. Comparisons of volume concentrations of polydisperse silver particles (a) prepared at room temperature (agglomerates) and (b) sintered at 400 °C (aggregates).
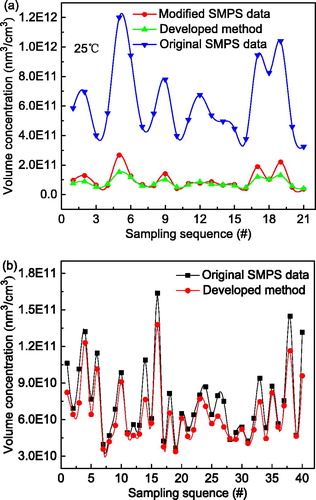
Figure 11. Comparisons of geometric surface area concentrations (GSACs) of polydisperse silver particles. Particles (a) prepared at room temperature (agglomerates) and (b) sintered at 400 °C (aggregates).
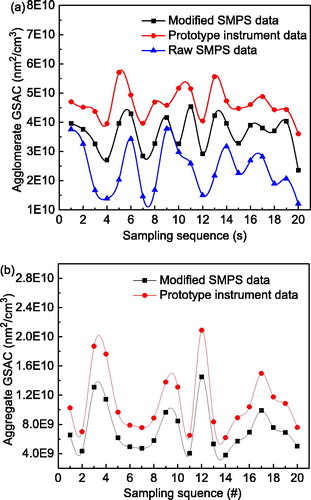
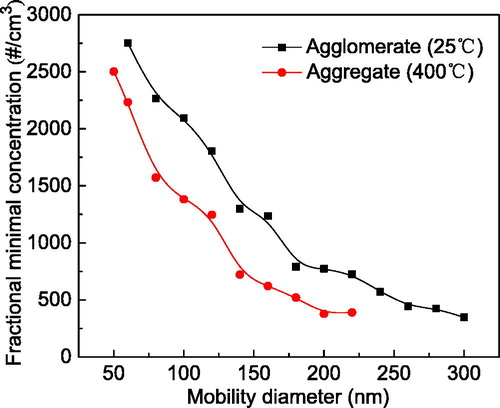
Figure 12. Fractional minimal concentrations over the detected size range.