
Figures & data
Figure 1. A schematic of the laser heating apparatus.
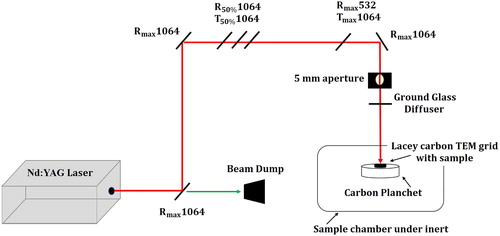
Figure 2. TEM micrographs of cookstove generated soot burning wet red oakwood showing (a, b) nascent and (c, d) laser annealed soot nanostructure.
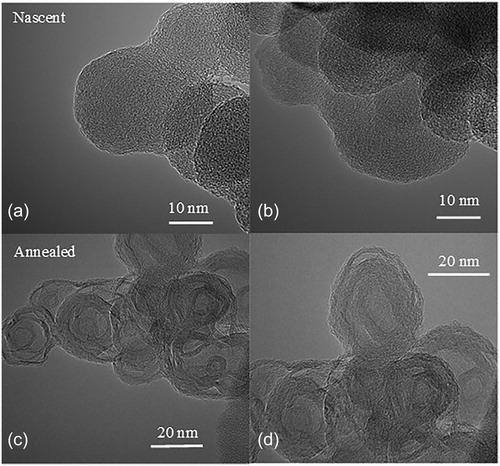
Figure 3. Length and tortuosity statistics of nascent and laser annealed cookstove generated soot.
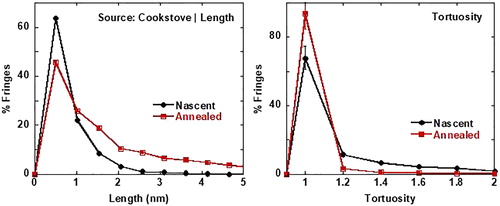
Figure 4. TEM images showing (Top row: a, c, e, g) nascent and (Bottom row: b, d, f, h) annealed nanostructure of ULSD, B5, B20, and B100 as indicated.
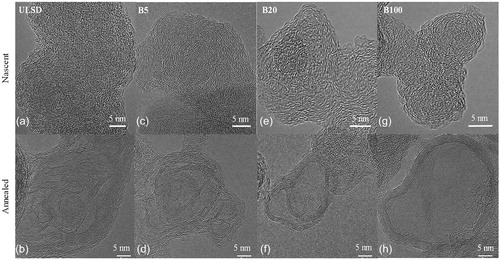
Figure 5. Fringe length and tortuosity statistics for nascent ULSD-, B5-, B20-, and B100-soot.
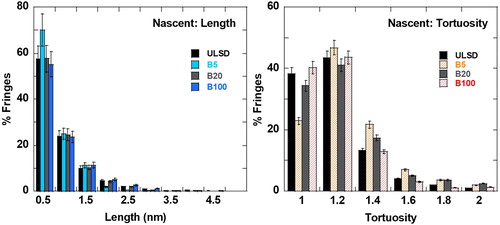
Figure 6. EDS maps showing relative carbon and oxygen content for ULSD, B5, B20, and B100.
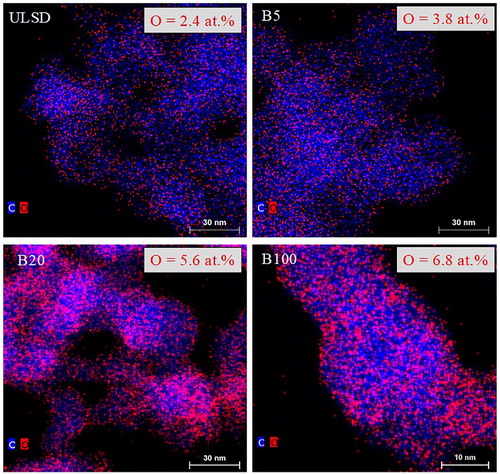
Table 1. Elemental C and O quantified by EDS.
Figure 7. XPS C1s spectra of ULSD-, B5-, B20-, and B100-soot.
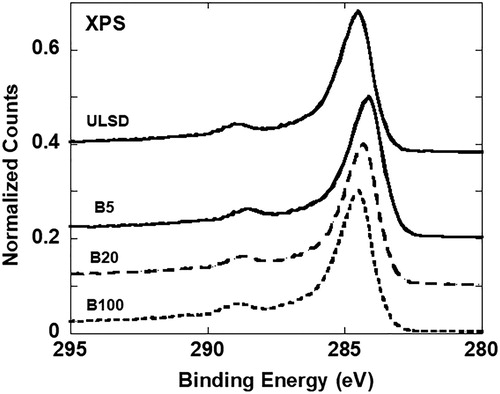
Figure 8. XPS curve fits to the C1s spectra of ULSD-, B5-, B20-, and B100-soot.
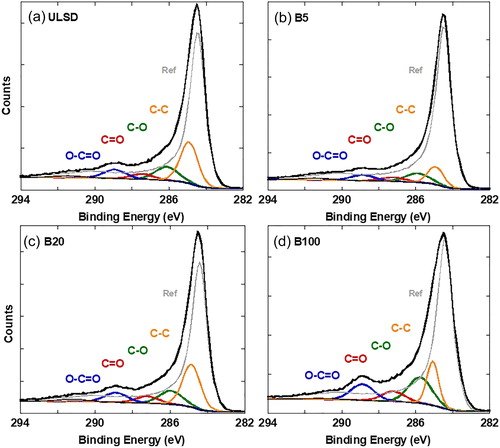
Table 2. Quantified at. % of C and O using XPS.
Figure 9. TEM micrographs of (a, b) 6- and (c, d) 48-hour HNO3 treated R250 after laser annealing with one pulse of the Nd:YAG operating with a fluence of 150 mJ/cm2 at the different indicated magnifications.
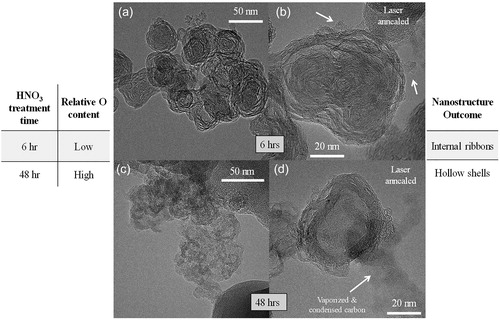
Table 3. Oxygen content comparison for biodiesel soot and functionalized carbon black.
Figure 10. TEM images showing (a, c) nascent and (b, d) annealed nanostructure of soot generated by a (top row) wood-fired boiler burning pine wood and (bottom row) cookstove burning oak wood.
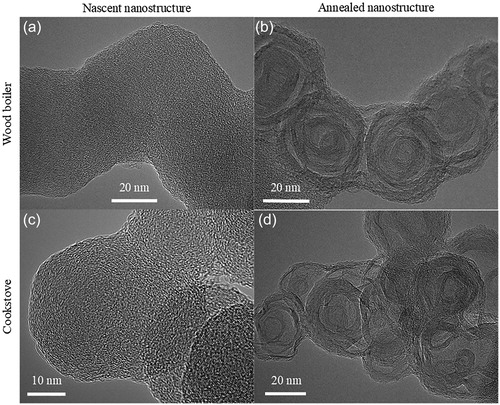
Figure 11. Fringe statistics showing similarity in the degree of change observed after laser heating soot from a wood boiler and a cookstove.
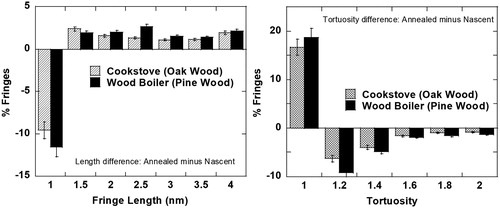
Table 4. C and O quantification for wood-fired boiler and cookstove soot by EDS and XPS.