
Figures & data
Figure 1. Cross-sectional sketch of the Perez DMA with key components: [1] NW-40 flange for sheath gas entry. [2] 1st prelaminarization stage (one roughly stretched screen; optional). [3] Perforated inlet plate centering the upstream end of the inner rod. [4] One of 24 openings in the inlet plate allowing passage of the sheath gas. [5] 2nd prelaminarization stage (filtering medium, or roughly stretched screen). [6] Laminarization stage, including three or four well-stretched screens. [7] Nut for tensioning and centering the inner rod. [8] Cylindrical mating surface to center inner rod. [9] Conical inner rod. [10] One of 24 circularizer holes communicating the aerosol flow with the inlet slit. [11] Annular chamber upstream of the circularizer. [12] Outlet slit. [13] One of 18 holes drawing the sheath gas out into the exhaust manifold. [14] NW-40 flange for sheath gas exhaust. [15] Antistatic aerosol outlet tube. [16] Insulating cone for downstream centering of inner rod. [17] Laminarization trumpet. [18] Aerosol inlet tube. [19] Grounded aerosol outlet tube.
![Figure 1. Cross-sectional sketch of the Perez DMA with key components: [1] NW-40 flange for sheath gas entry. [2] 1st prelaminarization stage (one roughly stretched screen; optional). [3] Perforated inlet plate centering the upstream end of the inner rod. [4] One of 24 openings in the inlet plate allowing passage of the sheath gas. [5] 2nd prelaminarization stage (filtering medium, or roughly stretched screen). [6] Laminarization stage, including three or four well-stretched screens. [7] Nut for tensioning and centering the inner rod. [8] Cylindrical mating surface to center inner rod. [9] Conical inner rod. [10] One of 24 circularizer holes communicating the aerosol flow with the inlet slit. [11] Annular chamber upstream of the circularizer. [12] Outlet slit. [13] One of 18 holes drawing the sheath gas out into the exhaust manifold. [14] NW-40 flange for sheath gas exhaust. [15] Antistatic aerosol outlet tube. [16] Insulating cone for downstream centering of inner rod. [17] Laminarization trumpet. [18] Aerosol inlet tube. [19] Grounded aerosol outlet tube.](/cms/asset/df0617c4-c814-417b-8276-02f65656281d/uast_a_1684433_f0001_b.jpg)
Table 1. Some characteristics of the Perez DMA and the 10 cm-Herrmann DMA.
Figure 2. Negative mobility spectrum for a bipolar electrospray of MPI-FAP, resolving over 14 clusters at Q = 440 Lit/min. 1 mV in the vertical scale correspond to 2 fA of ion current. The dashed line fitting the data is a linear superposition of 14 Gaussians.
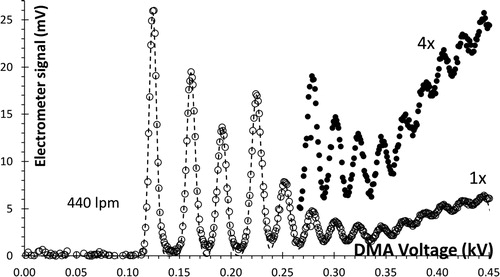
Table 2. Various flow restrictions in the sheath gas circuit (dimensions in mm).
Figure 3. Positive mobility spectra for EMI-Methide at various indicated sheath gas flows Q, with one (a) or two pumps (b). Data in (b) are shown as crosses, while the dashed line is a superposition of 17 Gaussians fitting the 17 most mobile experimental peaks. The vertical scale is in V, 1 mV corresponding to 2 fA of ion current.
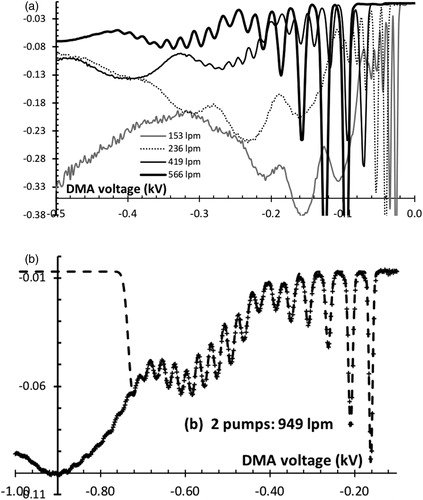
Figure 4. Resolving power of the Perez DMA, determined from the data of . The origin of the current scale is artificially shifted upwards from 0 to 1.2 mV, to display the sensitivity of the inferred resolution in the presence of a small continuum background of contaminants. The straight dashed line through the origin is a theoretical reference for the resolution due to diffusion alone, though the slope shown of 1.32 V1/2 is a fit to the four most mobile peaks rather than theoretically calculated.
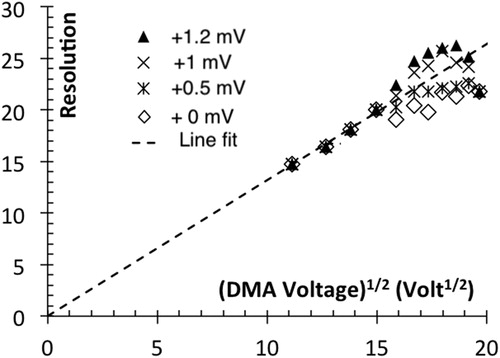
Figure 5. Apparent resolution in various tests, including those of and , with one and two pumps, respectively. The dashed line is the diffusive limit from .
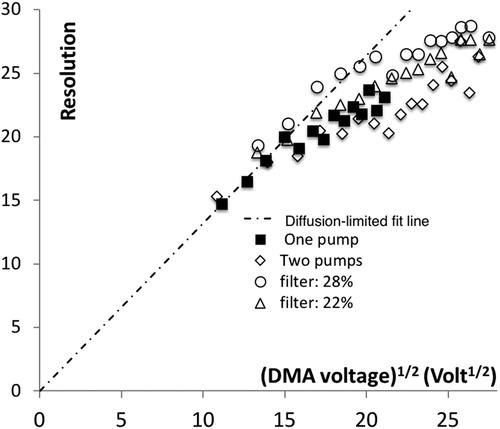
Table 3. Maximal flow rate achieved for various DMA configurations, all with 3 screens in the laminarizing stage [6] having 28% open area.
Figure 6. Peak width FWHMz for charge-reduced immunoglobulin G ions, used as a test aerosol of finite intrinsic width, at three moderate values of the sheath gas flow Q and several aerosol flow rates q. The continuous lines in the main figure are theoretical widths convoluting the Knutson Whitby triangular transfer function for a (non-diffusing) monodisperse aerosol with a Gaussian mobility distribution with widths (FWHMZ) of 5% and 6%. The inset shows measured raw mobility peaks for Q = 110 Lit/min.
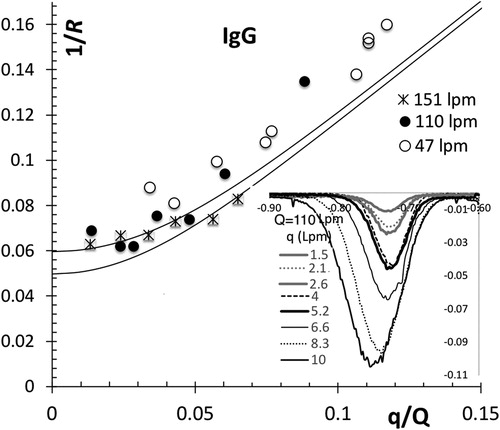
Table 4. Peak width for the Vienna UDMA (Kallinger et al. Citation2013).