Figures & data
Figure 1. NOEC produced by CH Technologies (Westwood, NJ, USA) (top). Schematic of flow inside a one-tier 12-port NOEC (bottom).
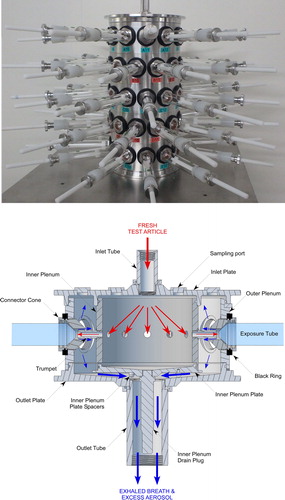
Figure 2. Schematic of NOEC experimental setup for measurement of aerosol homogeneity at different ports.
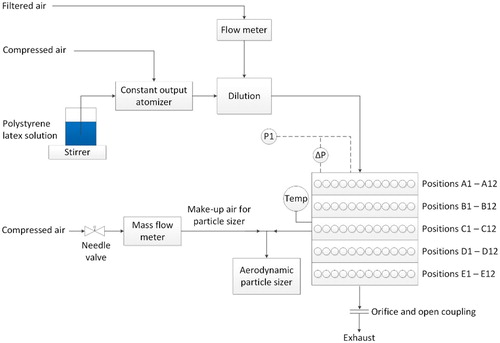
Table 1. Average air conditions during testing.
Table 2. Particle number density normalized by its value at the inlet of the NOEC.
Figure 3. Inner chamber computational domain. Simulations were performed in only a 90° segment of the domain.
Figure 4. Mean air velocity from all ports of Tiers A–E expressed as a percentage of mean air velocity from all ports. The velocity sampling probe was positioned 8 mm outside the exposure tube.
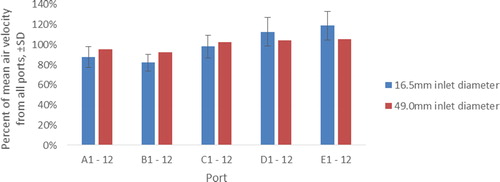
Figure 5. Average particle number density expressed as a percentage relative to its value at the inlet of the NOEC. Averages for ports 1, 5, and 9 of Tiers A, C, and E are plotted. PSL particles (diameters 0.56 μm, 1 μm, and 1.6 μm) were tested.
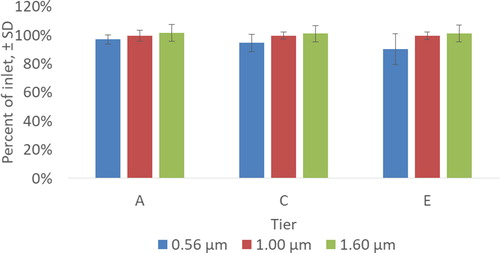
Figure 6. Visualization of the flow inside the inner chamber. Flow streamlines are plotted and colored by the magnitude of the flow velocity.
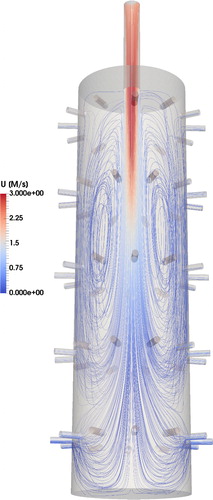
Figure 7. Comparison of computational and experimental results for the normalized port velocity at each tier expressed as a percentage of the average values.
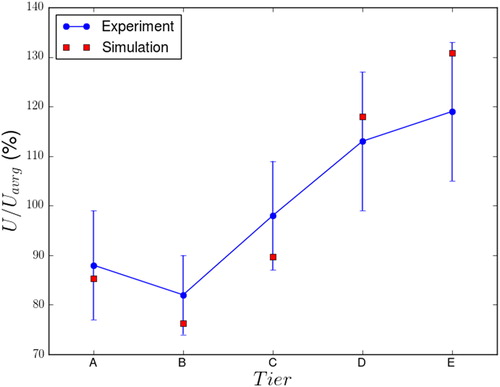
Figure 8. Particle number density M normalized by the average inlet value. Values are computed inside the exposure trumpet of each port, 8 mm in front of the exposure tube.
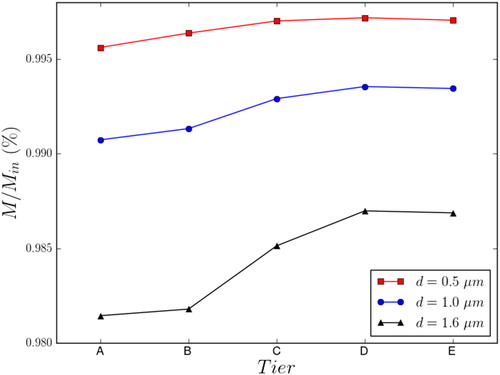
Figure 9. PSL particle number density M normalized by the inlet value Min in the inner chamber plotted against particle diameter. Profiles for Tiers A, C, and E are shown.
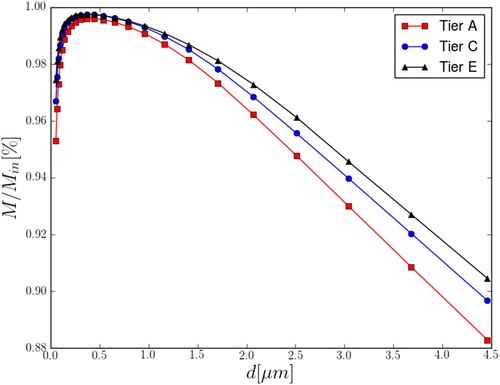
Figure 10. Visualization of CFD predictions in the nose-port assembly. Flow streamlines (left) and velocity [m/s] contours (right) in a steady 150 mL/min respiratory minute volume are shown.
![Figure 10. Visualization of CFD predictions in the nose-port assembly. Flow streamlines (left) and velocity [m/s] contours (right) in a steady 150 mL/min respiratory minute volume are shown.](/cms/asset/c56179a4-6c1d-4fb6-a6fb-25ea937a29d5/uast_a_1687843_f0010_c.jpg)
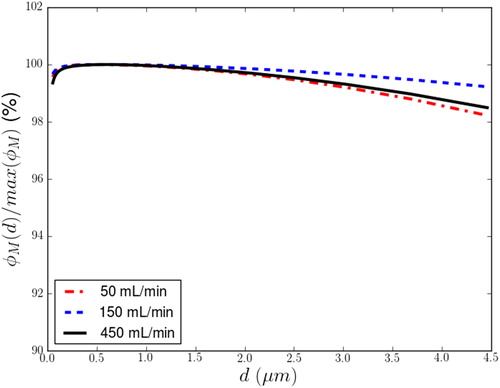
Figure 11. Sampling efficiencies in the nose-port assembly for constant respiratory flows of 50 mL/min, 150 mL/min, and 450 mL/min.