Figures & data
Figure 1. Schematic diagram of the toroidal Hy-DMA.
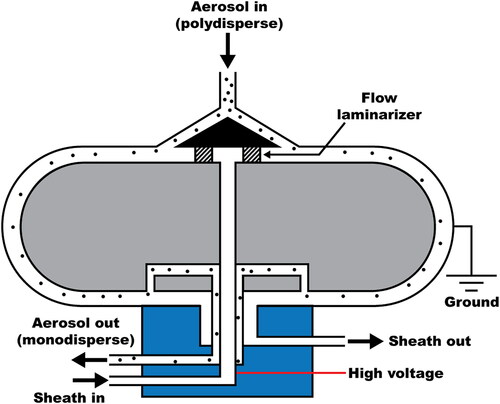
Table 1. Representative cylindrical DMAs for classifying large particles.
Figure 2. Experimental schematics for the evaluation of the toroidal Hy-DMA (a) using a TSI standard long-DMA and CPC for sizing accuracy and (b) using two identical Hy-DMAs to obtain the transfer functions of the toroidal Hy-DMA.
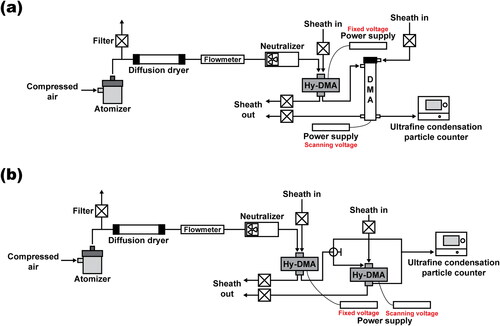
Figure 3. Calculation domain for the numerical study of the toroidal Hy-DMA and the boundary conditions.
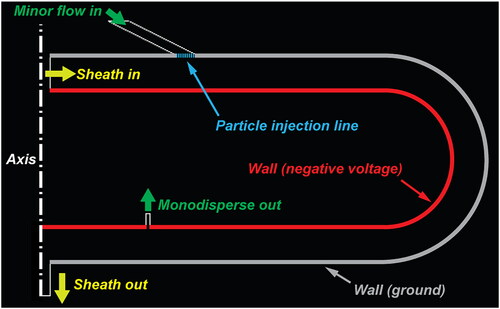
Figure 4. (a) Normalized velocity magnitude at the injection line in the aerosol inlet and (b) schematic explanation of the single particle tracking method.
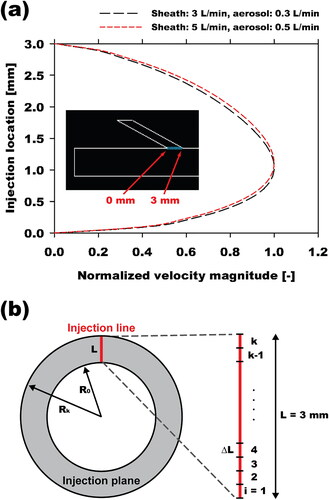
Figure 5. Central electrical mobility as a function of voltage applied to the toroidal Hy-DMA for the sheath-to-aerosol flow rate ratio of 3:0.3 and 5:0.5 L/min.
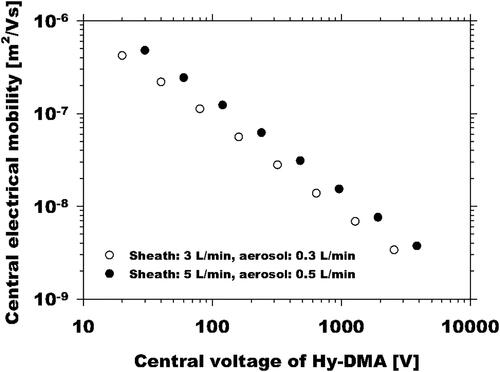
Figure 6. (a) Comparison between experimental and predicted TDMA curves for the toroidal Hy-DMA for 68 nm particles and (b) transfer functions of the toroidal Hy-DMA for 23, 68, and 238 nm particle sizes obtained via the deconvolution process at the sheath-to-aerosol flow rate ratio of 3:0.3 L/min.
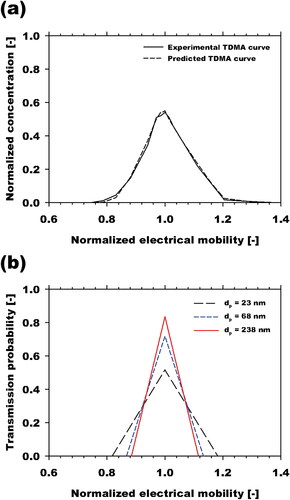
Figure 7. Schematic diagram of (a) velocity streamline and (b) vectors of electric field colored by electric potential at the aerosol inlet and monodisperse outlet. The units are [m/s] for the velocity streamline and [V] for the electric potential.
![Figure 7. Schematic diagram of (a) velocity streamline and (b) vectors of electric field colored by electric potential at the aerosol inlet and monodisperse outlet. The units are [m/s] for the velocity streamline and [V] for the electric potential.](/cms/asset/f5419d94-94cb-47dc-9e3c-bae3b32969d8/uast_a_1701625_f0007_c.jpg)
Figure 8. Exemplary particle trajectories of different-sized particles in the toroidal Hy-DMA under the voltage of 320 V and sheath-to-aerosol flow rate ratio of 3:0.3 L/min: (a) 90 nm; (b) 94 nm; (c) 98 nm; (d) 102 nm; (e) 106 nm.
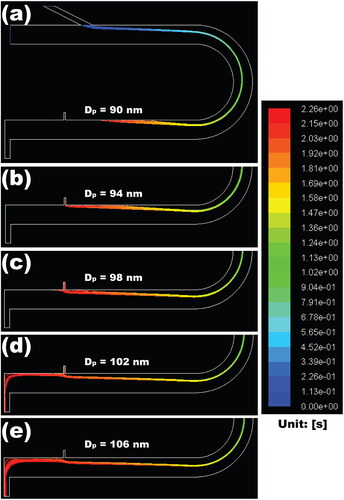
Figure 9. Transmission probabilities of the toroidal Hy-DMA as a function of particle diameter obtained by the single particle tracking analysis for the sheath-to-aerosol flow rate ratio of (a) 3:0.3 and (b) 5:0.5 L/min.
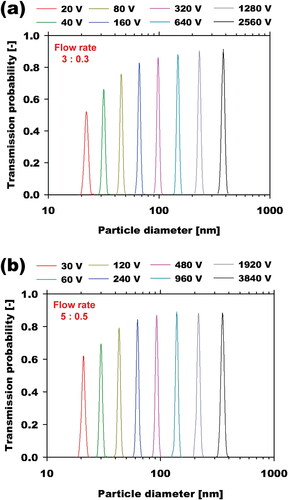
Table 2. Comparison of central particle sizes obtained by experiments and numerical simulations.
Figure 10. Normalized transmission probabilities as a function of normalized particle electrical mobility obtained by the single particle tracking analysis for the sheath-to-aerosol flow rate ratio of (a) 3:0.3 and (b) 5:0.5 L/min.
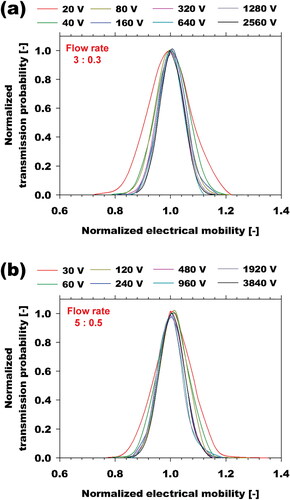
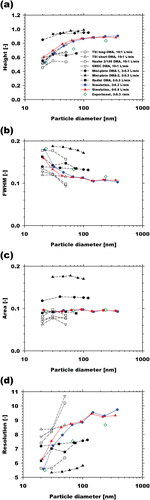
Figure 11. (a) Heights and (b) FWHMs, (c) area and (d) sizing resolution of the toroidal Hy-DMA transfer function plotted with those of different types of DMAs from other literatures.