Figures & data
Table 1. A summary of different aerosol dynamic models.
Table 2. Modeling plan.
Figure 1. The schematic of the modal model (a) general description of modal model (b) assigning a volume to its adjacent nodes.
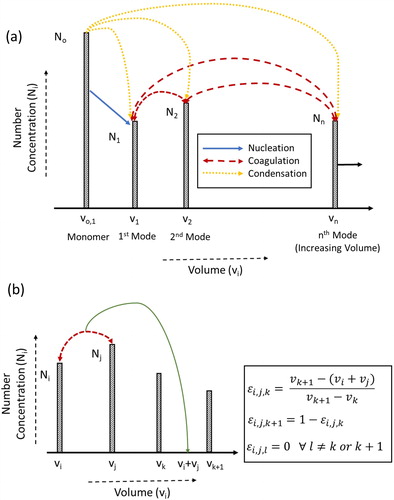
Figure 2. Working principle of AAQRL-ADM software.
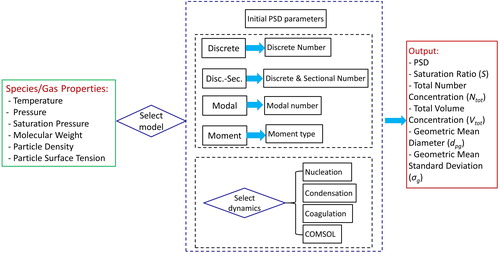
Figure 3. Graphical User Interface (GUI) of AAQRL-ADM (https://github.com/AAQRL/aerosol_dynamic_models; DOI: 10.5281/zenodo.3571284) software. (a) Main window; (b) Discrete model window.
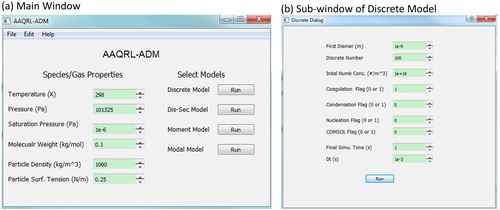
Figure 4. The particle size distribution (PSD) after the final time for (a) monodisperse case and (b) lognormal case.
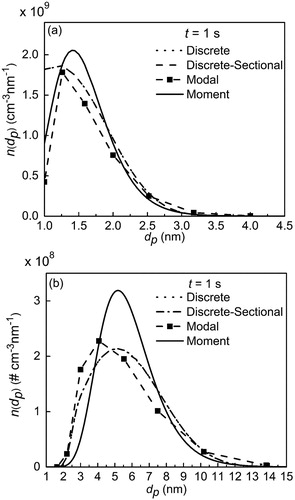
Table 3. Comparison of ensemble parameters by different models.
Figure 5. Comparison of discrete, discrete-sectional, moment and modal modes when considering both coagulation and nucleation effects (a) simulated PSD at t = 2 × 10⁻³ s, (b) simulated PSD at t = 0.1 s, (c) total number concentration (Ntot) vs. time, and (d) mean diameter (dp,mean) vs. time.
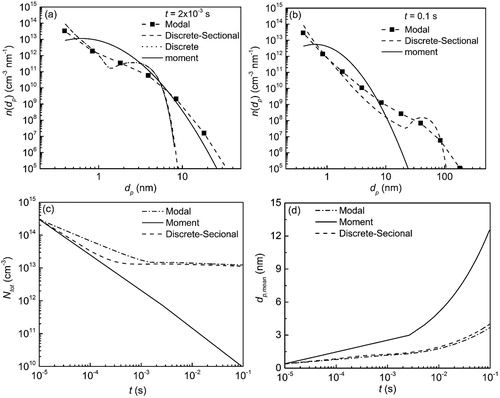
Figure 6. PSD vs. particle size for condensation case (a) depleting vapor concentration (b) constant vapor concentration.
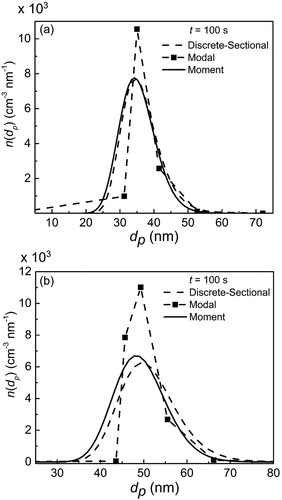
Table 4. Comparison of ensemble parameters for particle condensation.
Figure 7. Simulation results of simultaneous nucleation, condensation and coagulation case (a) Ntot vs. t, (b) saturation ratio (S) vs. t, and (c) mean diameter (dp,mean) vs. t.
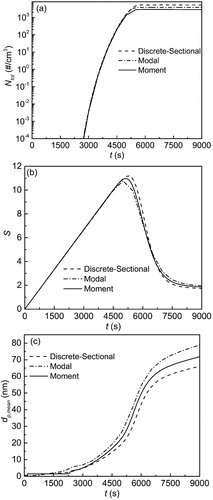
Figure 8. Computational time and Vtot vs. discrete number for pure coagulation case with initial PSD of lognormal distribution. (open square: Vtot; closed square: CPU time cost; dash line: fitting curve for CPU time cost).
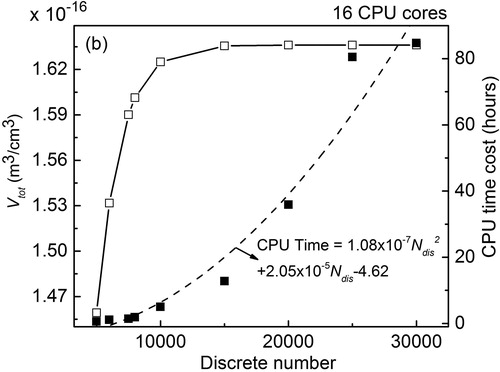
Table 5. Comparison of computational time cost of different models.
Figure 9. Schematic of (a) the furnace tube and (b) the computational domain (L = 83.5 cm; R = 0.95 cm).
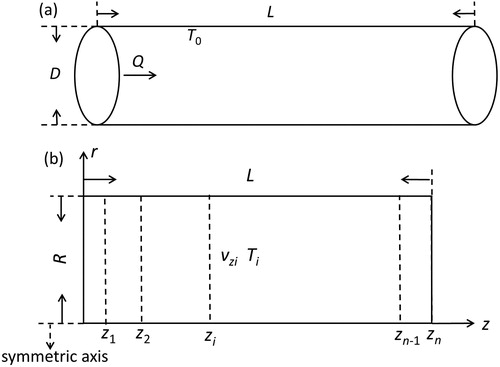
Figure 10. Gas temperature profile along z-axis in the furnace tube.
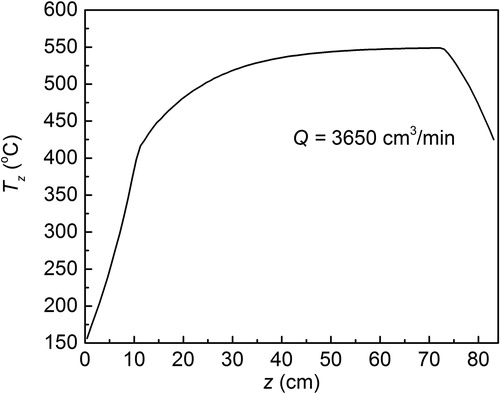
Figure 11. Comparison of simulated PSD by discrete-sectional, modal, and moment models at different positions.
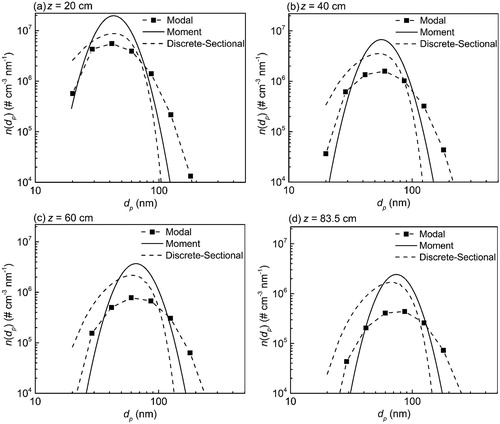
Table 6. Comparison of ensemble parameters by discrete-sectional, modal, and moment models for different positions.
Table B1. Dimensionless coagulation and condensation coefficients in free molecular and continuum regimes for moment model.
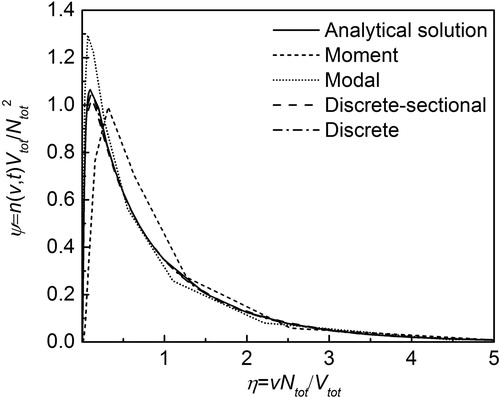
Figure D1. Self-preserving particle size distribution calculated by moment, modal, discrete and discrete-sectional models, compared with analytical solution (Vemury and Pratsinis Citation1995).