
Figures & data
Figure 1. (a) Scheme of a VitroCell automated exposure station (air-liquid interface exposure system). The aerosol path from outside to the exposure site is kept at a temperature of 37 °C by the system containment heater and circulation. It is conditioned to a relative humidity of 85% in the humidifier. The particles are isokinetically sampled from the humidifier and transported to the exposure wells in horizontal sampling lines. Flow rate through the well is controlled for 100 cm3 min−1. Six wells are grouped into an exposure module. The system holds three modules with identical properties. One exposure module is used for clean air reference. The section numbers indicate the calculation steps for particle loss estimation (). (b) Scheme of the air-liquid interface (ALI) exposure setup. The aerosol is delivered to the ALI via a trumpet-shaped flow-guiding element. Particles deposit onto the cells by diffusion and sedimentation. The well keeps the insert in place. Cells grow on a membrane in the insert with the medium from the basolateral and the exposure aerosol from the apical side. Ri is the inlet radius, Rw the radius of the membrane of an insert in a well and ht the distance of the trumpet from the cell membrane (see ).
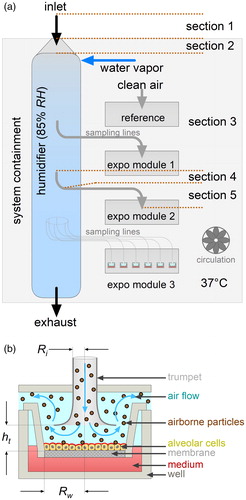
Table 1. ALI characteristics. (a) Parameters for the ALI deposition EquationEquation (1a(1a)
(1a) ) are taken from Comouth et al. (Citation2013), his . The value for m0 is modified here to fit the experimental data in his Figure 9. Model results are valid for the operational parameters in . (b) Operational and geometric parameters of the ALI setup. (c) Parameters for the estimation of the particle transmission from the inlet of a VitroCell automated exposure station to the inlet of a well-trumpet (see ).
Figure 2. (a) Parameters of the lung structure model of Yeh and Schum (Citation1980) corrected for a mean lung volume of 3 675 cm³ with EquationEquation (2b(2b)
(2b) ). The model is extended with a nose or mouth and an oropharynx (Ferron, Haider, and Kreyling Citation1988; Ferron, Kreyling, and Haider Citation1988). Data are presented as a function of the lung generation i. Nose or mouth is i = 1, the oropharynx i = 2, the trachea i = 3, the main bronchi i = 4, the last bronchi i = 11, the bronchioles i = 12 to 19 and the alveolar ducts i = 20 to 26 (ICRP Citation1994). Background colors indicate the extra-thoracic (ET, green), tracheo-bronchial (TB, blue) and alveolar (AL, red) lung region. (b) Parameters calculated from the lung structure model of Yeh and Schum (Citation1980) (see part (a)). Surface area Alung(i) of a lung generation i is calculated with EquationEquation (4)
(4a)
(4a) . (c) Lung deposition calculated with the HPLD model as a function of lung generation and particle size. Blue color marks nearly zero deposition, red color maximum deposition. Calculation is performed for spherical particles with a density of 1 g cm−3 and for a sitting male adult breathing by mouth with a tidal volume of 750 cm³, a constant respiration airflow, an equal in- and exhalation time (). (d) Same as (c), but for nose breathing.
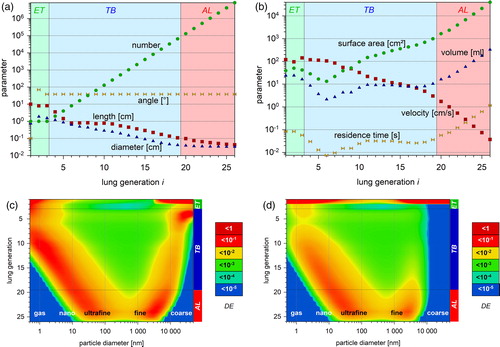
Table 2. Surface area of the cell layer at the ALI and of the lung structure of Yeh and Schum (Citation1980) corrected for a lung volume of 3675 cm³. The alveolar surface area is calculated with EquationEquation (4c(4c)
(4c) ). Total lung surface area is taken from Reference Man (ICRP Citation1975).
Table 3. Parameters used for the HPLD model calculations (Ferron et al. Citation2013). The respiration conditions are for a quietly breathing male person (ICRP Citation1994).
Table 4. Properties of several human lung cells and ALI cell lines. The weighted average of type-I and type-II pneumocytes is used for the TL calculations, as type-I cells contribute 94% to the epithelial surface area and type-II cells 6%. For the ALI exposure, the A549 cell line is assumed. BEAS-2B and 16HBE cell lines are included for comparison.
Table 5. Parameters for the lognormal particle size distribution used as airborne particle exposure scenario. It mimics the size distribution of a diesel emission with 100 nm modal diameter. The corresponding mass median diameter is derived by Hatch-Choate conversion (Hinds Citation1999). Number and mass distribution are adjusted for a total concentration of 106 cm−3 and 1 mg m−3, respectively.
Figure 3. (a) ALI and regional lung deposition. Deposition at the ALl is calculated with EquationEquation (1a(1a)
(1a) ) as a function of particle size. Total and regional lung deposition is calculated with the HPLD model for mouth respiration. Modeling conditions are listed in and for ALI and lung, respectively. (b) Ratio DElung(r)/DEALI of the regional lung deposition and the ALI deposition (a). The horizontal bars show the half-width for the ET (green), TB (blue), AL (red) and TL (yellow) region ().
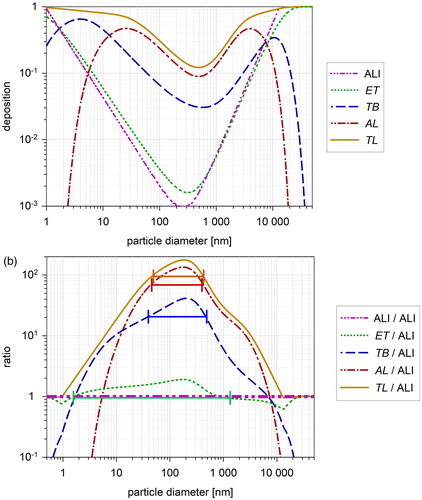
Table 6. Half-width ranges for the ratio DElung(r)/DEALI and DAlung(r)/DAALI. All values between the maximum (100%) and half of the maximum (50%) of a size distribution are found within the HW range ( and ). The value “mean” is at ¾ of the maximum. Ratio−1 is the inverse DA-ratio meaning how many fold the dose at the ALI is higher than in the lung (“dose correction factor”).
Figure 4. (a) Deposition per surface area for the ALI and for the lung regions. Mean surface deposition in the ALl is calculated with EquationEquation (5a(5a)
(5a) ) as a function of particle size. Total and regional lung surface deposition is calculated with the HPLD model for mouth respiration using EquationEquation (5b
(5b)
(5b) ) (see ). The ordinates on the right show the corresponding particle number and mass delivered per surface area at the ALI and in the lung regions. They are calculated with EquationEquations (6b)
(6b)
(6b) and Equation(6c)
(6c)
(6c) , respectively. Ordinates represent simultaneously the TD for an exposure number concentration of 1 cm−3 and for an exposure mass concentration of 1 µg m−3. Thereby te is set to 1 h for both ALI and lung and Q to 100 cm3 min−1 () for the ALI and to 0.54 m3 h−1 for the lung, what results in a constant factor of 6 × 10³ and 540 × 103, respectively. (b) Ratio DAlung(r)/DAALI of the regional lung surface deposition and the ALI surface-deposition (). The horizontal bars show the half-width for the ET (green), TB (blue), AL (red) and TL (yellow) region ().
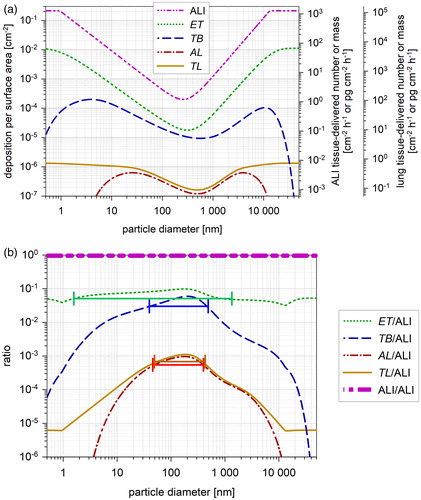
Figure 5. Particle transmission to the site of deposition as a function of particle size. ALI transmission is calculated (without any pre-impactor) from the ALI inlet to a well (see and ). Human inhalability follows the ICRP convention (Brown et al. Citation2013). Mouth and nose transmission is calculated with the HPLD model, showing the particle transfer to the beginning of the tracheo bronchial tract (TB, i > 2) and to the beginning of the alveolar space (AL, i > 19). The transmission efficiency for exhaled particles is added. The expression “mouth to TB” is used as a shortcut for “mouth breathing to enter the tracheo-bronchial region,” and “mouth to AL” as a shortcut for “mouth breathing to enter the alveolar region.”
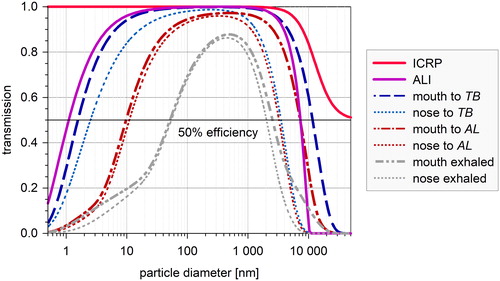
Table 7. Particle transmission to the ALI and different lung regions for inhalation (see ). For comparison the HW of the exhaled particles is indicated.
Figure 6. Surface-delivered particle mass (a) and cell-delivered particle number (b) at the ALI and in the lung regions. The airborne exposure concentration is 1 mg m−3 in (a) and 106 cm−3 in (b). A lognormal emission distribution is applied (see ). Part (b) compares the load for cells in different lung regions. The corresponding cell counts (cells per cm2) are indicated in the columns. For the ALI, the size of A549 cells is assumed, for ET and TB region the cell size is assumed to be identical with type-II pneumocytes. For the AL region the size of type-I pneumocytes and for TL the weighted average of type-I and type-II cells is assumed ().
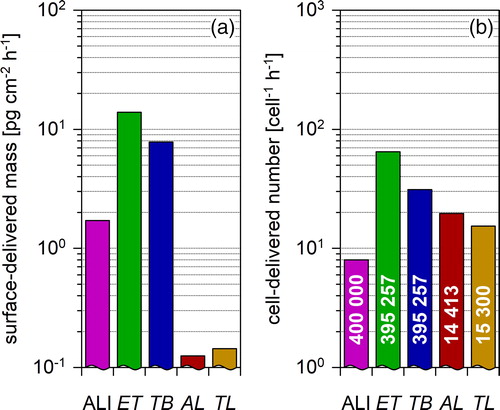
Table 8. Deposition in the lung regions of an adult man calculated with the HPLD model () compared to lung deposition data published by the ICRP, Annexe F (1994). Data are for a polydisperse aerosol with a mean particle diameter of 100 nm, a GSD of 1.5, a particle density of 3 g cm−3 and a shape factor of 1.5.