Figures & data
Table 1. Emission norms across the countries.
Figure 1. The experimental facility consisted of a stack and systems for optical measurement, gravimetric sampling, aerosol feeding and data acquisition, respectively. The stack (6 m high and 20 cm circular cross-section) is operated in once through mode, where the stack velocity and aerosol feed rate is varied to change the concentration of the aerosol.
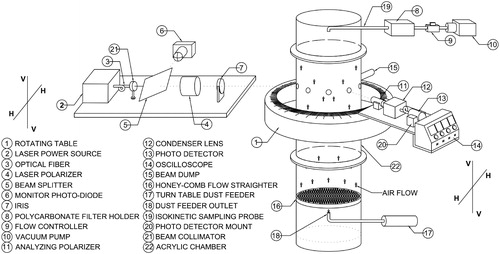
Figure 2. Turntable dust feeder with venturi aspirator. The diameter of the turntable is 30 cm with the groove size 10 mm wide and 1 mm deep in which dust was fed through gravity from the rotating dust reservoir, which was then picked up by the venture nozzle. The venture nozzle operated at a pressure of 3 barg to deliver approximate feed rate of 70 mg/min at 10 rpm.

Figure 3. SEM micrograph for sampled flyash aerosol, where particles are seen to be agglomerated and irregular in shape as compared to water droplet which is expected to be spherical.
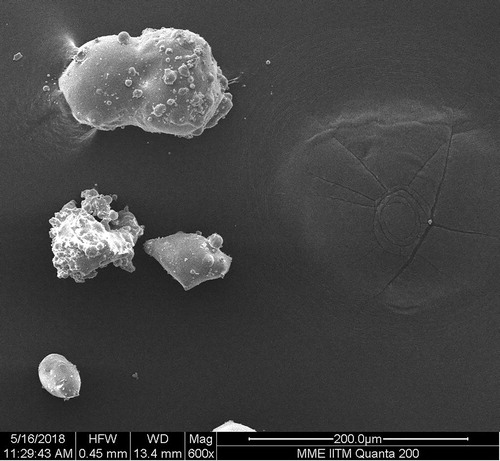
Figure 4. Velocity profile in the stack (turbulent regime ()). A constant temperature anemometer (DANTEC DYNAMICS-54T42, 55P11) was used to characterize the velocity profile in the stack where the center line velocity varied from 5-15 m/sec.
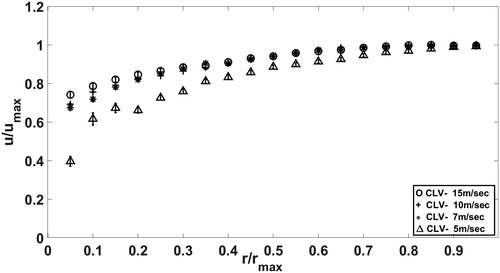
Figure 5. Sampling flyash at different conditions. Turntable speed: 10 RPM, stack velocities: L2 and L3 are the two sampling locations in port P1 as shown in the figure. The dotted line is the total amount of dust supplied to the wind tunnel from dust feeder (initial dust in reservoir - final dust in the reservoir - collection from bottom of tunnel).
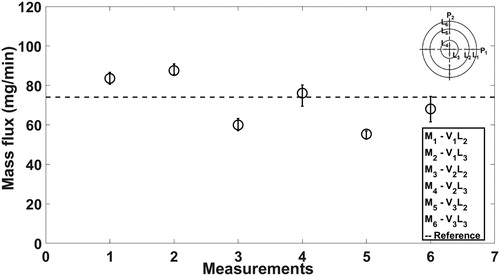
Figure 6. Gravimetric sampling measurement at different feed rates: concentration () vs. flow rate at different feed rate (changed by changing the RPM of the dust feeder). The slope of the curve is constant implying that as the flow rate is increased the concentration of the dust in the tunnel decreases.
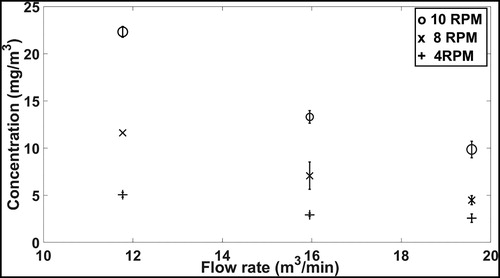
Figure 7. Schematic of the optical components configuration while at forward scatter angle, and
back scatter angle. It shows position of the light source or laser and the detector used for scattered light measurement at different angles.
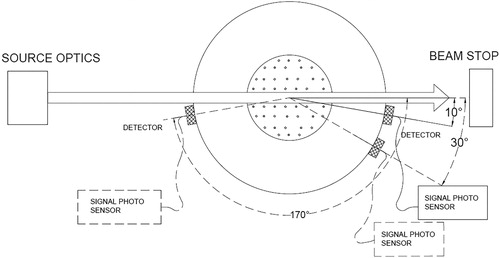
Figure 8. Normalized Phase function F11 derived from experiment for water droplets in comparison with Sassen and Liou (Citation1979).
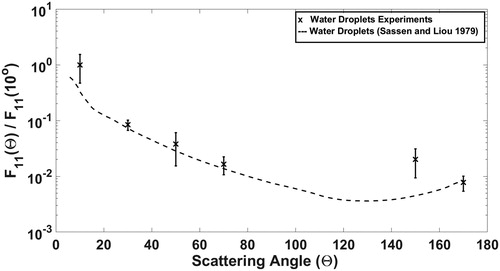
Figure 9. Variation of with scattering angle for water droplets and flyash aerosol. Comparison with experimental data from Muñoz et al. (Citation2001, Citation2010).
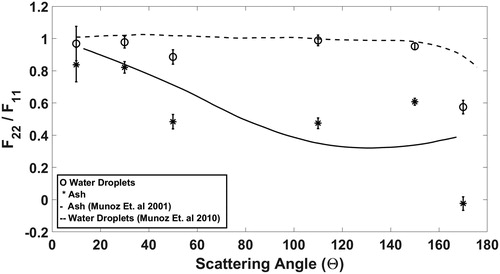
Figure 10. Polarization ratio for water and flyash aerosol ().
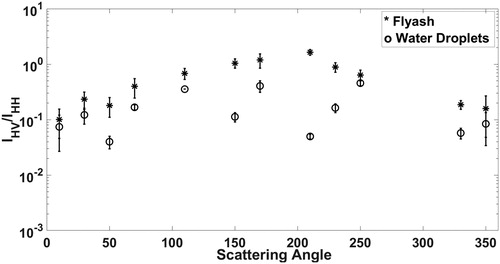
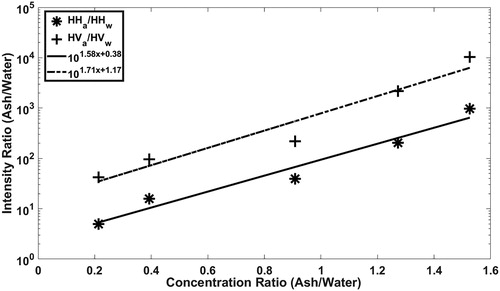
Figure 11. Intensity ratio v/s. loading rate ratio (flyash: water droplets): this plot is from the laboratory stack measurements, demonstrating the use of intensity ratios to resolve mixture concentrations at 170° back scatter angle.