Figures & data
Figure 1. Flow diagram of the experimental setup.
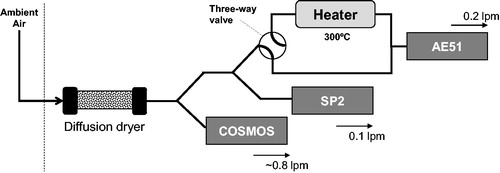
Figure 2. Correlation between EBCCOSMOS and rBCSP2 for 1-min (shaded circles) and 15-min average (black circles) datasets. The fitted lines are also shown as bold lines in the corresponding color.
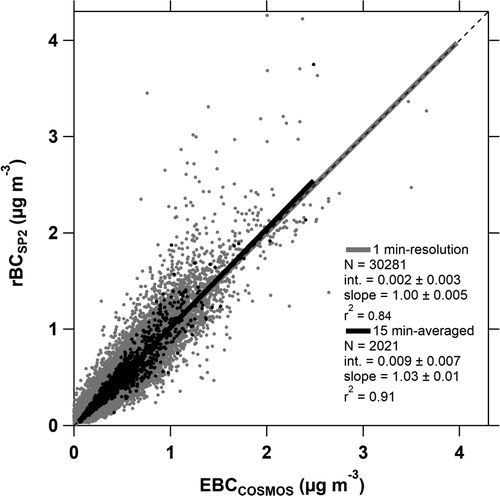
Figure 3. (a) Temporal variation of 15-min averaged for heated (
red line in lower panel) and unheated modes (
blue line in lower panel), rBCSP2 (black line and black filled area in lower and upper panels, respectively), and nonBCSP2 (shaded filled area in upper panel, cumulated to rBCSP2) for the entire observation period; (b) as for 3(a) for
and rBCSP2 using the same coloring for the period from00:00 14 May to 10:00 15 May, 2017.
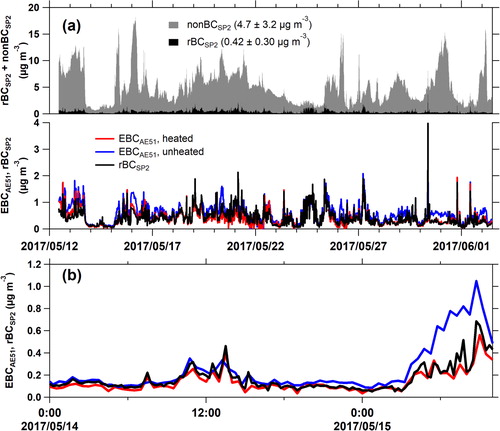
Table 1. Proportion of negative values and LOD of the datasets with a 1-min (raw) resolution and averaging for 2-, 5-, and 15-min durations.
Figure 4. (a) Relationship between (Y-axis) and rBCSP2 (X-axis) for the heated (red circles) and unheated (blue circles) modes; (b) as in (a) but for the X-axis (EBCCOSMOS). The fitted lines are also shown in light red for the heated mode and light blue for the unheated mode.
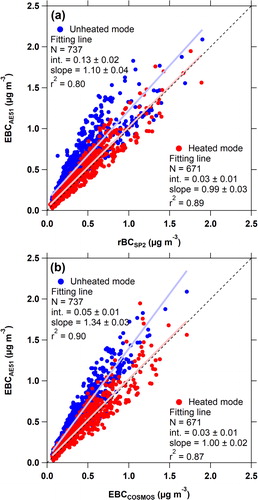
Figure 5. Diurnal variations in /EBCCOSMOS (light-colored lines) and
/rBCSP2 (primary-colored lines) for the heated (red lines) and unheated (blue lines) modes, and nonBCSP2/rBCSP2 (black circles, right axis).
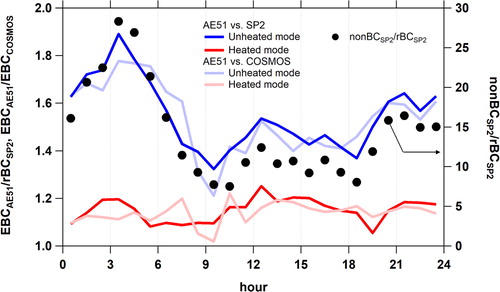
Figure 6. (a) Coefficients of determination (r2) and (b) linear regression slopes for the correlations between and EBCCOSMOS (light-colored lines) and between
and rBCSP2 (primary-colored lines) for the heated (red lines) and unheated (blue lines) modes as a function of ATNAE51; (c) as for (b) but with correction using EquationEquations (5)
(5)
(5) and Equation(6)
(6)
(6) . The averaged nonBCSP2/rBC SP2 ratios binned by ATNAE51 are also shown in (c) as solid lines and closed circles (right axis).
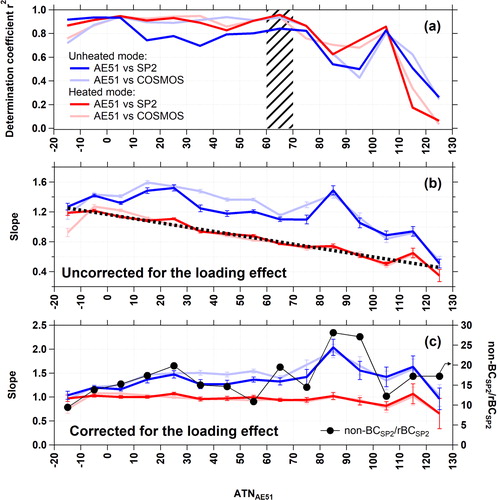
Figure 7. (Left panel) Relationship between /rBCSP2 and nonBCSP2/rBCSP2 (shaded circles). The 7-bin medians (with interquartile ranges) are sorted by nonBCSP2/rBCSP2 (open markers). The regression line of the binned datasets is also shown (black line, with the dashed line showing the extrapolation). The fitted coefficients with 95% confidence intervals are also shown; (Right panel) the probability distribution of
/rBCSP2.
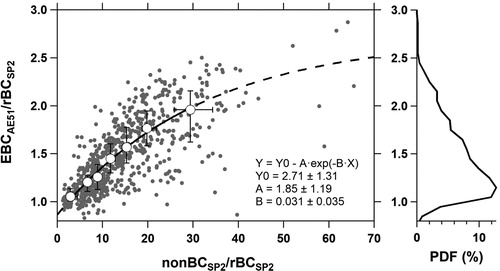
Figure 8. Correlations between corrected using EquationEquation (4)
(4)
(4) with rBCSP2 (a) and EBCCOSMOS (b), and between
corrected using EquationEquation (7)
(7)
(7) (shaded circles) and EquationEquation (8)
(8)
(8) (black circles) with rBCSP2 (c) and EBCCOSMOS (d). Dashed lines in (a) and (d) are depicted using a ratio of 1:1; (e) and (f) show the cumulative distributions of the ratio of
corrected using EquationEquation (7)
(7)
(7) (shaded) and EquationEquation (8)
(8)
(8) (black) with rBCSP2 and EBCCOSMOS, respectively.
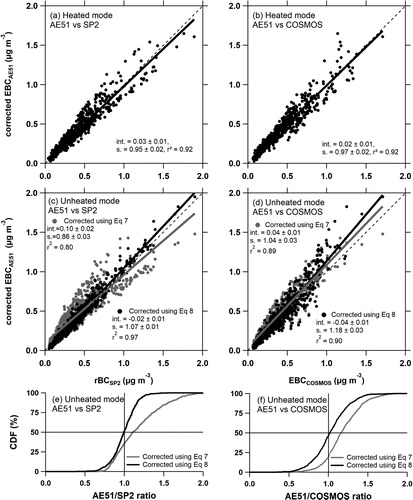
Table 2. Summary of intercomparison between the AE51 and the other instruments.
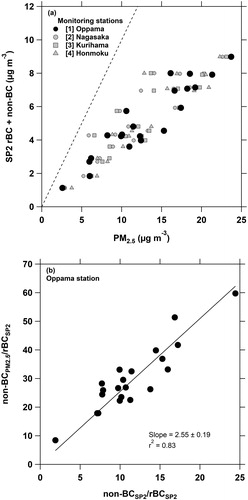
Figure 9. Correlations between (a) SP2-derived total aerosols (nonBCSP2 + rBCSP2) and PM2.5 aerosols at four environmental monitoring stations (Black circles = Oppama station; shaded circles = Nagasaka station; shaded squares = Kurihama station; shaded triangles = Honmoku station) and (b) between nonBCSP2/rBCSP2 ratios and nonBCPM2.5 (≡ PM2.5 - rBCSP2)/rBCSP2 ratios at Oppama station. The dashed line in (a) is shown using a ratio of 1:1.