Figures & data
Table 1. Principal results already published.
Figure 1. Changes in experimental specific cake resistance of alumina oxide particles versus relative humidity and for various aerosol diameters (from Joubert et al. Citation2011).
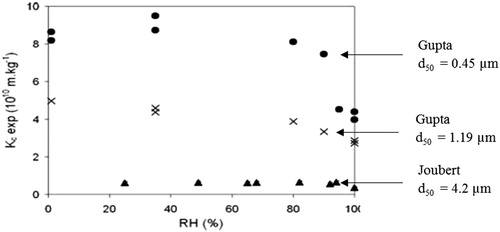
Figure 2. Experimental test bench design.
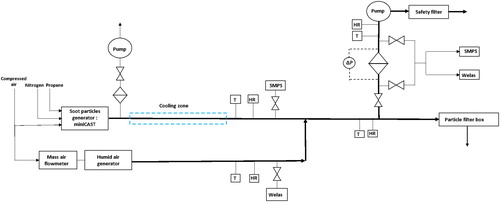
Figure 3. Description of the experimental protocol.
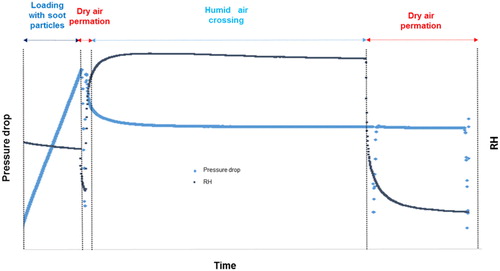
Table 2. Experimental characterization of two soots from the results of (Bescond et al. Citation2014; Yon et al. Citation2015) Df fractal dimension, kf fractal prefactor, ρpp density, Dp primary diameter, OC/TC organic carbon on total carbon.
Figure 4. Particle size distribution of the two generated soot.
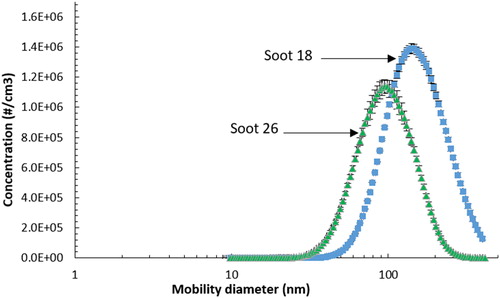
Figure 5. Evolution of the pressure drop of a clean filter subjected to increasing levels of relative humidity.
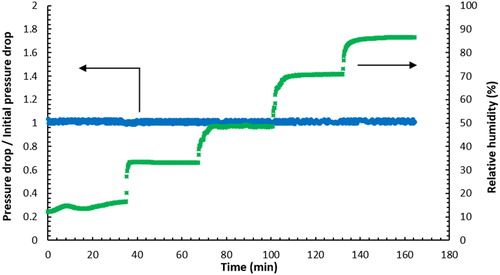
Figure 6. Evolution of the pressure drop of flat HEPA filters versus collected surface mass of soot particles at two different relative humidity.
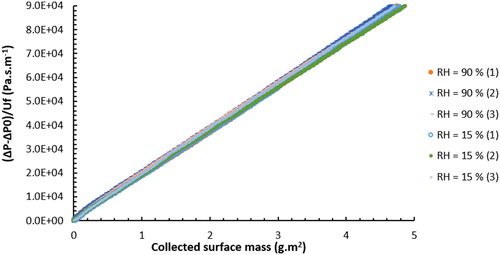
Figure 7. Time variation in pressure drop across flat filters D-309 during clogging until 3500 Pa with soot particles for three different rates of relative humidity (soot 18).
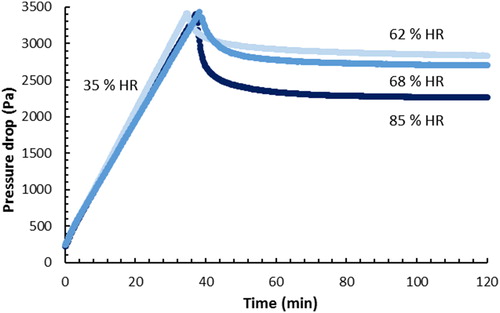
Figure 8. Time variation in pressure drop across flat filters D-309 during clogging until 2500 Pa with soot particles for three different rates of relative humidity (soot 18).
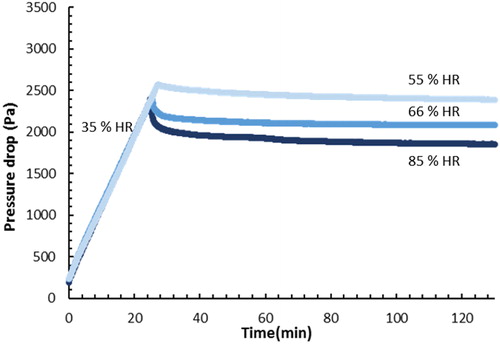
Figure 9. Time variation in pressure drop across flat filters D-309 during clogging until 1500 Pa with soot particles for three different rates of relative humidity (soot 18).
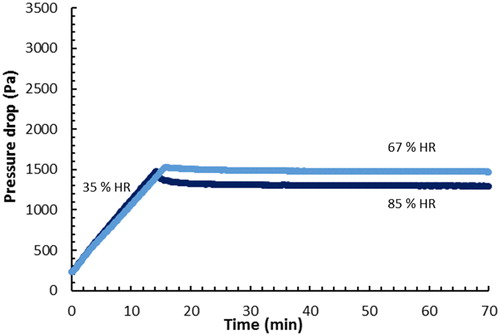
Figure 10. Evolution of the flow resistance in function of the relative humidity (soot 18).
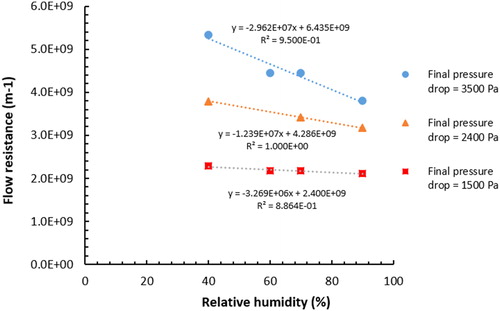
Figure 11. Evolution of the flow resistance in function of the relative humidity (soot 26).
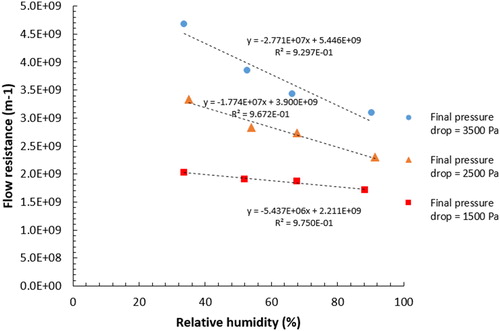
Figure 12. Evolution of the pressure drop in function of the time (Deposit 3500, soot 26): comparison between the numerical expression (line) and experimental results (point).
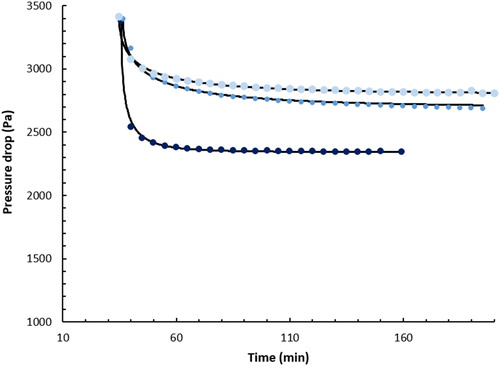
Table 3. Characteristic parameters (soot 18).
Table 4. Characteristic parameters (soot 26).
Table 5. Values a1, b1, a2, b2 found for the two soot.
Figure 13. Evolution of the coefficient of proportionality as a function of the relative humidity (soot 18).
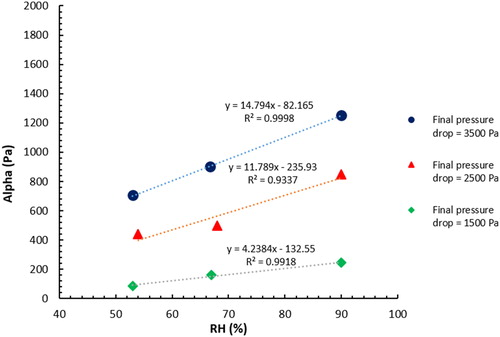
Figure 14. Evolution of the coefficient of proportionality as a function of the relative humidity (soot 26).
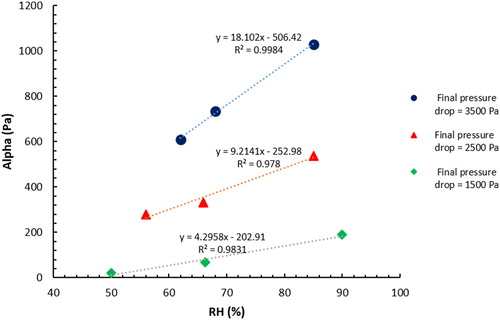
Table 6. Experimental pressure drop of clogging relative humidity (HR), final pressure drop after humid air
and model pressure drop
for soot 18.
Table 7. Experimental pressure drop of clogging relative humidity (HR), final pressure drop after humid air
and model pressure drop
for soot 26.
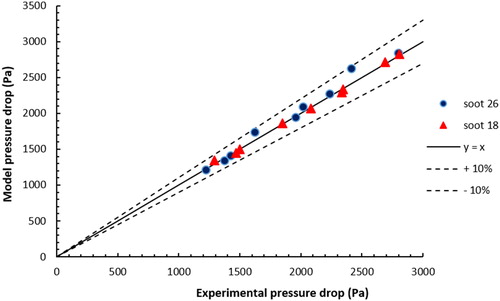
Figure 15. Model pressure drop as a function of the final experimental pressure drop.