Figures & data
Figure 1. Schematic of the experimental setup for generating unoxidized and oxidized (with NO3) BrC.
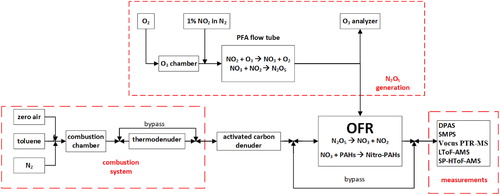
Figure 2. (a) Evolution of the imaginary part of refractive index (k) at λ = 473, 532, and 671 nm of light, medium, and dark BrC, quantified as the ratio of k of the oxidized BrC (koxidized) to k of the unoxidized BrC (kunoxidized). (b) The corresponding evolution of the wavelength dependence (w). Smaller w is indicative of darker BrC. Error bars represent standard deviations over time for one experiment. Numerical values of kunoxidized, koxidized, and w are given in Table S1.
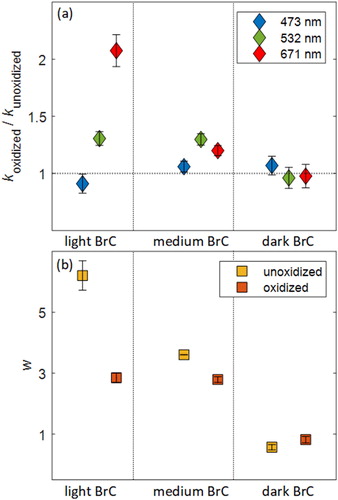
Figure 3. AMS and SP-AMS UMR spectra of organic aerosol components in unoxidized light BrC and dark BrC aerosols.
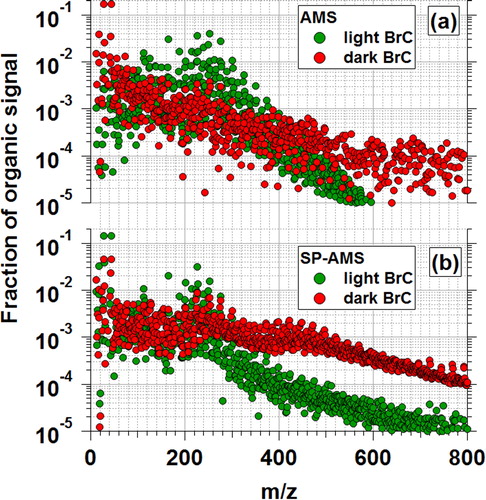
Figure 4. (a) AMS and (b) SP-AMS HR spectra of organic and nitrate signals in the unoxidized light BrC, and (c) AMS and (d) SP-AMS HR spectra of organic and nitrate signals in the oxidized light BrC (exposed to NO3 radicals at 2.4 nights of equivalent atmospheric NO3 exposure).
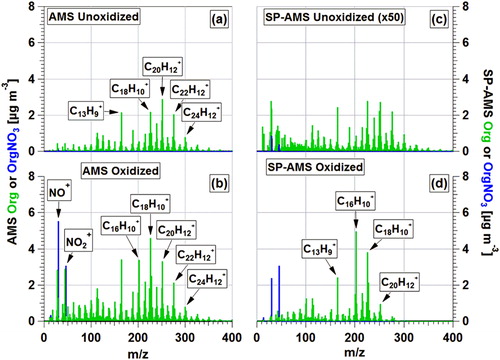
Figure 5. Van Krevelen diagram showing the H/C versus O/C for unoxidized (open symbols) and oxidized (solid symbols) BrC. Symbols are colored by N/C. Error bars represent ±12% uncertainty in O/C and ±4% uncertainty in H/C (Canagaratna et al. Citation2015).
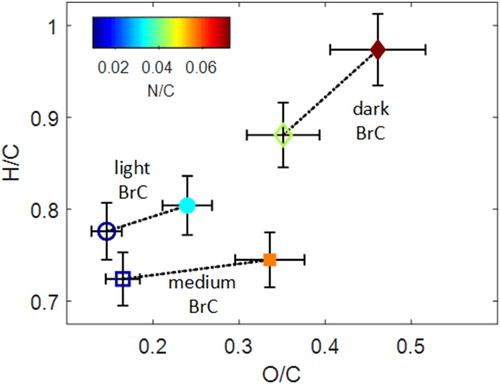
Figure 6. Calculated relative contribution of heterogeneous oxidation to adding nitrogen (ΔNhet/ΔNtot) and oxygen (ΔOhet/ΔOtot) to the condensed phase as a function of assumed average carbon number of the condensing SOA molecules for (a, b) light, (c, d) medium, and (e, f) dark BrC.
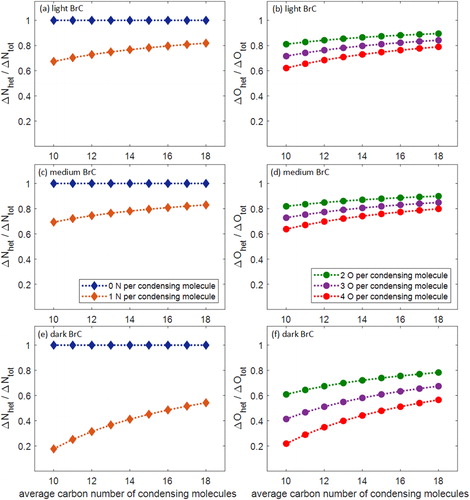
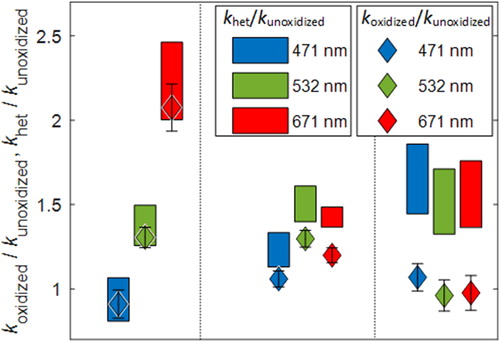
Figure 7. Effect of heterogeneous oxidation on light-absorption properties of the light, medium, and dark BrC. The bars represent ranges of khet/kunoxidized calculated based on EquationEquation (3)(3)
(3) . They reflect the assumed range of kSOA as well as the uncertainty in koxidized and kunoxidized (Table S1). The diamonds represent koxidized/kunoxidized (the same as in ), added here for reference to compare the effect of heterogeneous oxidation to the overall observed oxidation. Error bars represent standard deviations over time for one.