Figures & data
Figure 1. Photo showing the components of the experimental setup.
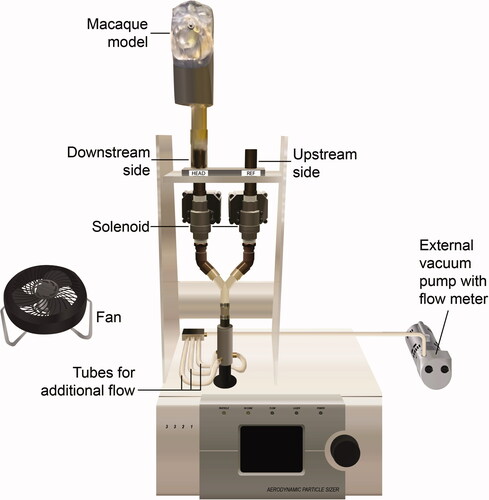
Table 1. Results from tests with Macaque 5990 to select an upper particle size limit for reportable data.
Figure 2. Photographs of the upper airway and trachea for each macaque used in the study. The upper airway, trachea, and exit tubing are labeled. Four metal rods were passed through four holes in each model segment to hold the segments together. This figure shows the models with one, or two, of the rods inserted through the four segments. Each model was attached to the APS through the exit tubing.
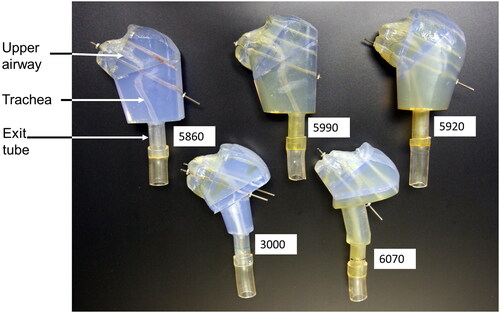
Table 2. Characteristics of the five, living Rhesus macaques upon which the UAT models were based.
Figure 3. Percent deposition in each of five models of the upper airways and trachea combined (UAT) for the Rhesus macaques, as well as percent deposition in the upper airways (no trachea) for each of 10 human subjects as a function of impaction parameter. Data for the 10 human subjects were obtained in vivo as part of a previously reported study (Kesavanathan and Swift Citation1998). Each UAT model is identifiable by symbol and number.
Figure 4. Percent deposition in each of five models of the upper airways and trachea combined (UAT) for the Rhesus macaques, as well as percent deposition in the upper airways (no trachea) for each of the 10 human subjects as a function of Stokes number. Each UAT model is identifiable by symbol and number. Data for the 10 human subjects were obtained in vivo as part of a previously reported study (Kesavanathan and Swift Citation1998).
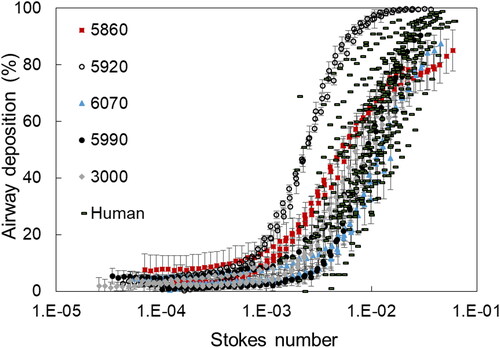
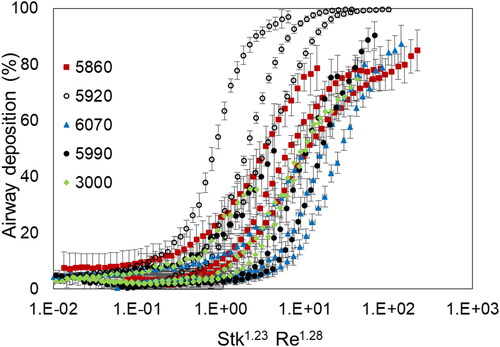
Figure 5. Percent deposition in each of five models of the upper airways and trachea combined (UAT) for the Rhesus macaques, as a function of a combination of Stokes number and Reynolds number. Each UAT model is identifiable by symbol and number.