
Figures & data
Figure 1. Schematic view of the PAC.
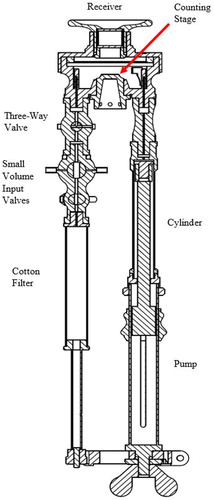
Figure 2. Operating positions of the three-way valve (B).
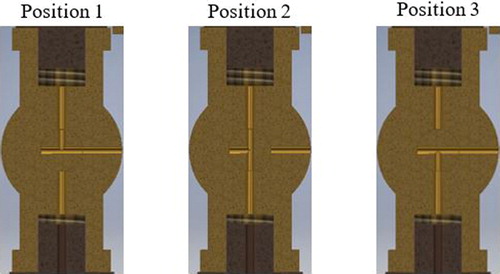
Figure 3. Autodesk Inventor model.
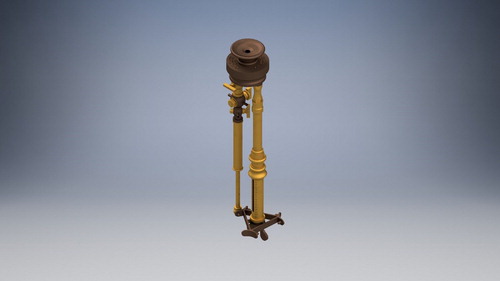
Figure 4. Schematic of experimental setup.
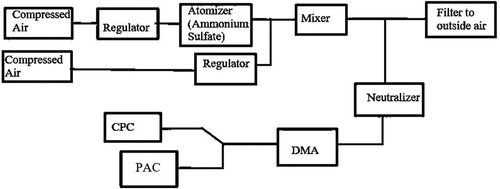
Figure 5. The counting stage before and after adjusting the images.
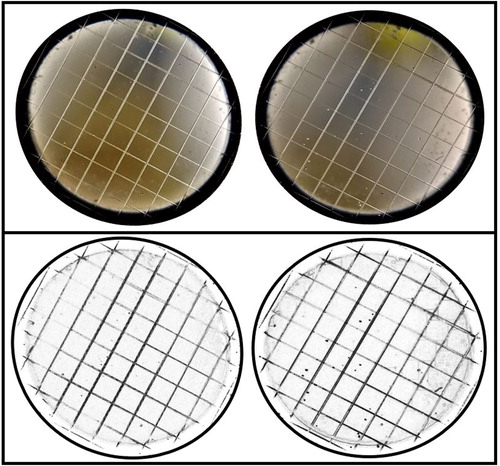
Figure 6. PAC efficiency of ammonium sulfate and ambient particles.
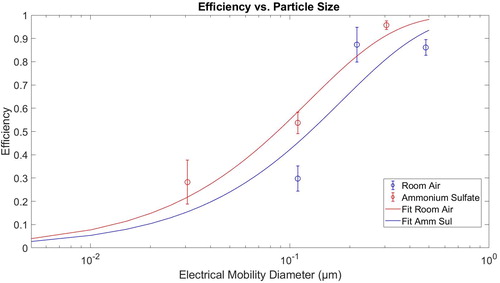
Table 1. Volume and pressure expansion ratios and expected supersaturations.
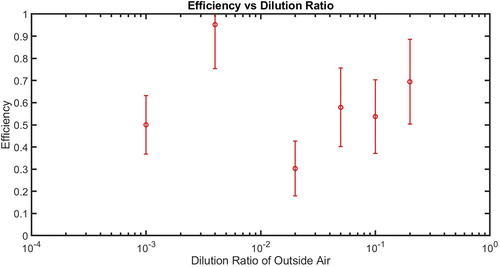
Figure 7. Efficiency of PAC with different dilution ratios.
Supplemental material