Figures & data
Table 1. Comparison between HEPA filter and different heights of the patterned surface.
Figure 1. (a) Computational domain of semicircular patterned surfaces and mesh distribution. (b) Turbulence kinetic energy (J/kg) along the Y-axis.
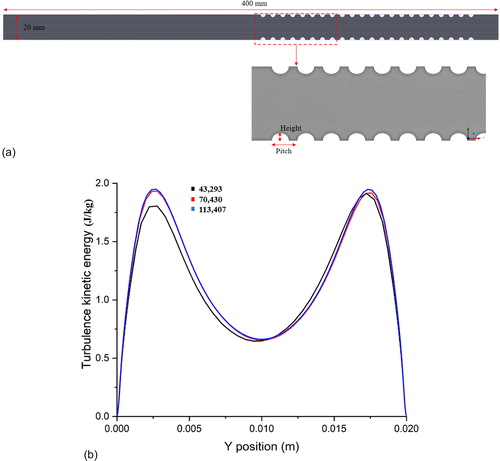
Figure 2. (a) Experimental setup and patterned surface for the semicircular height of (b) 2000 µm (p/e from left to right: 3, 4, 5, and 6) and (c) 500 µm (p/e from left to right: p/e = 3, 4, 5, 6, and 10).
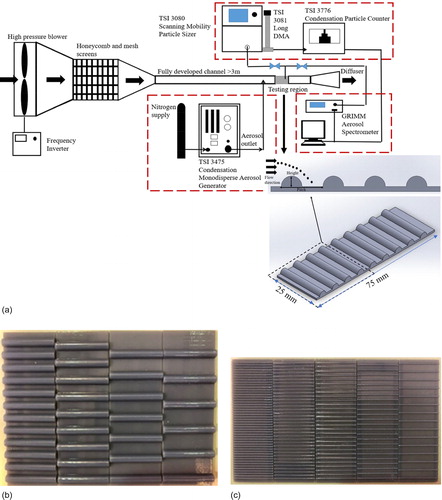
Figure 3. Comparison of nondimensional deposition velocity between experimental (black) and numerical simulation (red) at the semicircular height of 2000 μm for the particle size of (a) 2.5 µm and (b) 0.5 µm and semicircular height of 500 μm for the particle size of (c) 2.5 µm and (d) 0.5 µm.
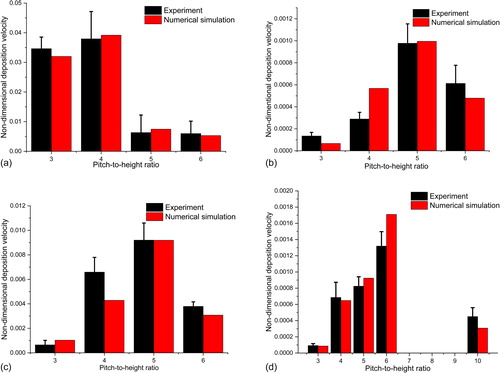
Figure 4. 0.5-µ particle trajectory at different time steps (p/e = 10): (a) 0.005 s; (b) 0.007 s; (c) 0.009 s; (d) 0.011 s; (e) 0.013 s; (f) 0.015 s.
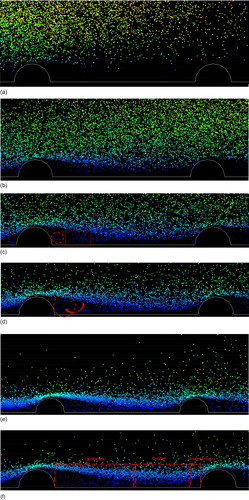
Figure 5. Comparison of enhancement ratio for different heights of semicircular patterns: (a) 2000 µm; (b) 1500 µm; (c) 800 µm; (d) 500 µm.
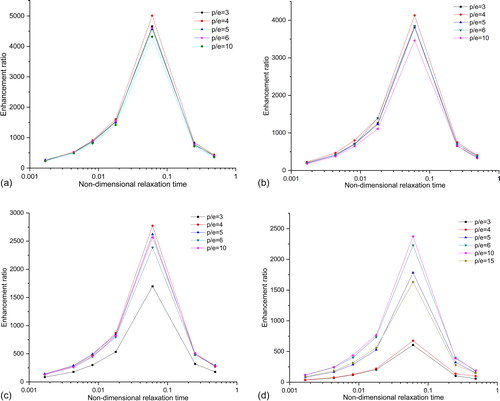
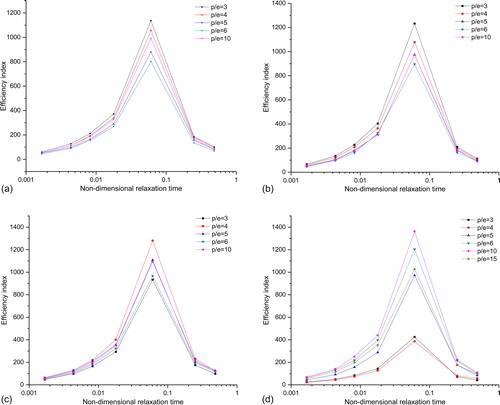
Figure 6. Comparison of efficiency index for different heights of semicircular patterns: (a) e = 2000 µm; (b) e = 1500 µm; (c) e = 800 µm; (d) e = 500 µm.