
Figures & data
Figure 1. Overall cumulative mass recovered (a) and recovery efficiency (b) from the artificially loaded filters in terms of test dust and filter type. Dashed lines connect first (black) and second (red) cycle of extraction over the same filter. Larger size markers denote heavily loaded filters (>4 g).
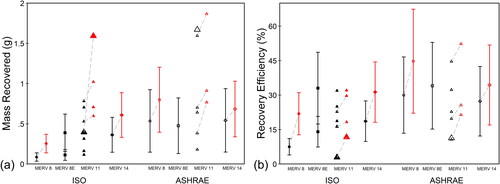
Figure 2. Particle size distribution of ISO and ASHRAE test dust and the recovered dust from MERV 11 filters (i.e., base cases). n refers to the number of analyzed samples.
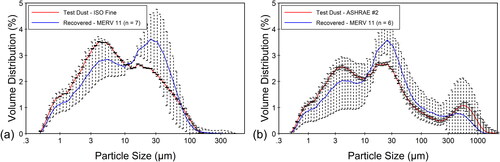
Figure 3. Cumulative overall mass recovered and recovery efficiency from the naturally loaded filters. Colors denote cycle number (black: cycle 1, red: cycle 2, and blue: cycle 3). n represents the number of filters that are included in each box.
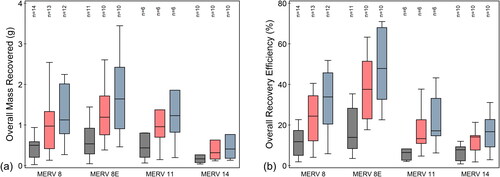
Table 1. Minimum dust mass required in terms of analytes, their MDL, and concentrations.