Figures & data
Table 1. Diameter of PSL particles that were used in past studies to evaluate the steep curve of the counting efficiency over sub-micrometer range.
Table 2. Specifications of the OPCs used in this study.
Figure 1. Experimental set-up for the calibration of two OPCs: (a) calibrating OPCs using an AAC and CPC (b) calibrating OPC using an IAG. The values in parenthesis are the sampling flowrate of each instrument with units of liters per minute.
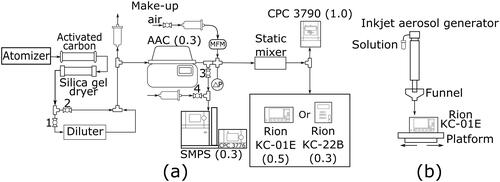
Figure 2. Simplified schematic of the experimental setup used to calibrate the OPC pulse heights as a function of PSL-equivalent optical diameter.
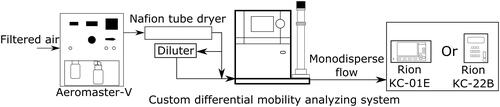
Figure 3. Calibration results for (a) KC-22B and (b) KC-01E OPC showing pulse height as a function of PSL particle size. A gain factor of 452 and 33.6 were used to convert the pulse height under low gain to high gain for KC-22B and KC-01E, respectively. The solid line represents the theoretical scattering cross section integrated over the collection angle of each OPC. The calculated results are scaled to fit the measured light scattering intensity. (c) Apparent size resolution of the two OPCs used in this study.
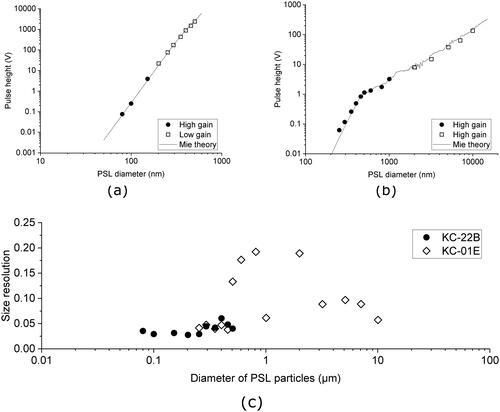
Figure 4. The relationship between the optical diameter and mobility diameter of the AAC-classified DOP particles for the KC-22B (a) and KC-01E (b) OPCs.
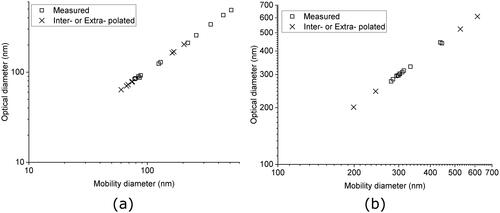
Figure 5. Rion KC-22B OPC counting efficiency plotted as a function of mobility diameter. Inset shows OPC counting efficiency plotted as a function of optical diameter.
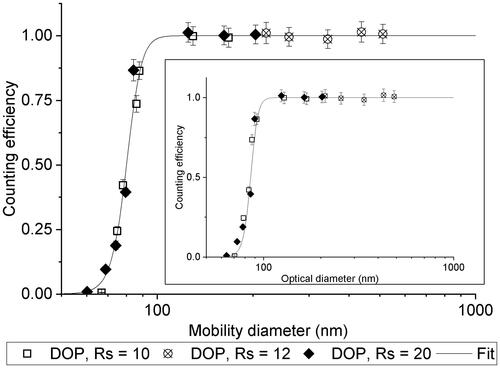
Figure 6. Rion KC-01E OPC counting efficiency plotted as a function of mobility diameter.
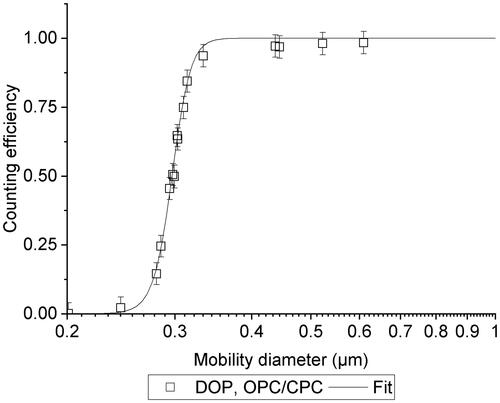
Figure 7. Rion KC-01E OPC counting efficiency plotted as a function of optical diameter to represent the entire range of the OPC.
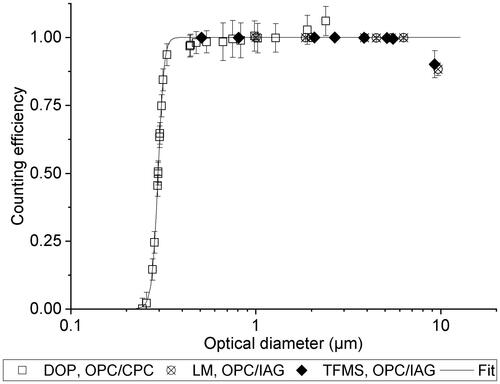
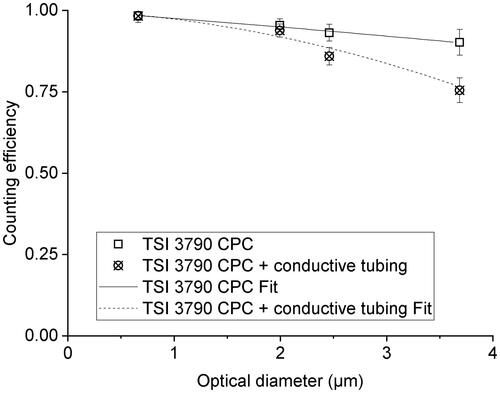
Figure 8. The counting efficiency of the TSI 3790 CPC using TFMS droplets particles and the IAG. Error bars represent 95% confidence intervals.