Figures & data
Table 1. Comparison of CERMS and TOA in the context of EC calibrations.
Figure 1. Sampling configuration used in this study. CERMS: CPMA-electrometer reference mass standard. CPMA: centrifugal particle mass analyzer. ESP: electrostatic precipitator. CPC: condensation particle counter. MFC: mass flow controller. Y: wye splitter. SM: static mixer. Filters f (front) and b (back) are referred to by EquationEquation (3).
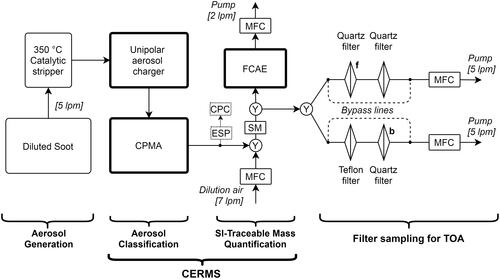
Table 2. Properties of the soot generated and used in this study.
Figure 2. Comparison of PM mass determined by TOA–Elemental-Analysis and by CERMS. Error bars show one standard error. Fit is uncertainty-weighted least-squares minimization; fit uncertainties show 95% confidence intervals. The fitted slope and intercept are not significantly different from one and zero, respectively, indicating agreement between the two techniques.
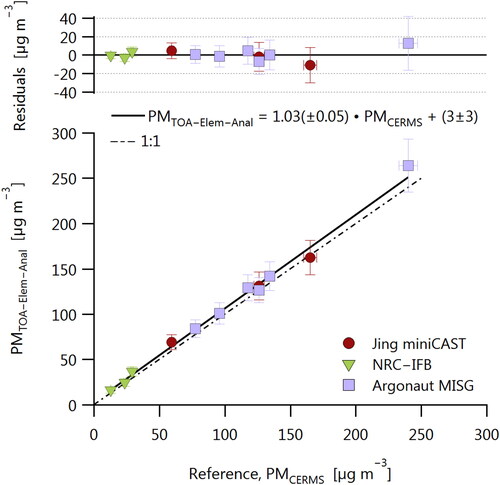
Figure 3. Demonstration of CERMS-based EC calibration at low concentrations using an Artium LII 300 instrument. The filter sampling apparatus in was replaced with the LII 300 for this experiment. Calibration was performed with (red circles) and without (black triangles) catalytic stripper. Inset shows the lowest measured concentrations and 0.35 µg m−3 minimum value reported by the LII 300. The dotted line labeled “TOA” represents a filter-based TOA calibration sample taken at 2470 µg m−3 over 5 min. At the lowest concentration used for the CERMS calibration (0.2 µg m−3), a filter would have required >17 days of sampling.
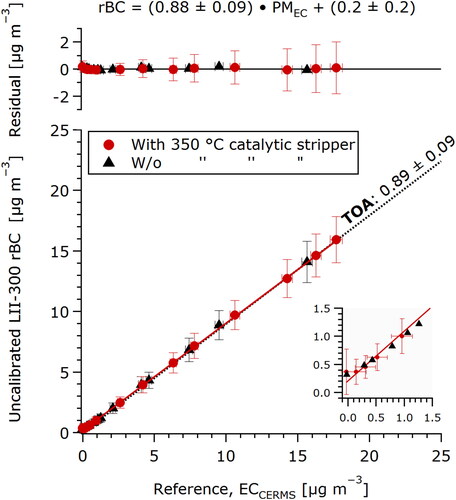
Figure 4. Demonstration of the CERMS as a reference measurement for determining the linearity of an optically calibrated photoacoustic spectrometer (PAX). The PAX optical calibration is performed at extremely high concentrations (green triangle), and is normally extrapolated to zero without quantification of its lower limit of detection (LOD). The CERMS data show that this extrapolation is valid for concentrations down to a few µg m−3, with a lower limit strongly dependent on the stability of the relative humidity (RH) of the gas. The upper panel shows the ratio of the PAX- and CERMS-reported mass concentrations, which could be used to calculate a mass absorption coefficient.
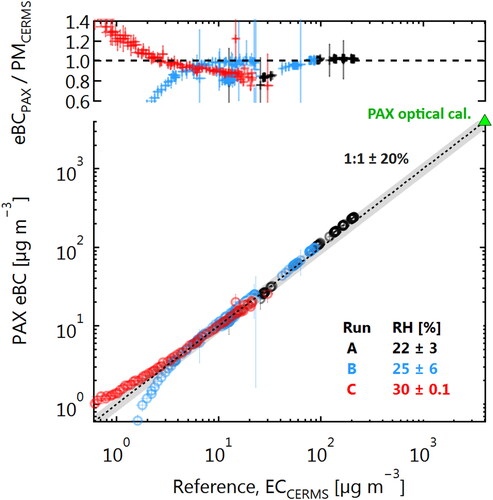
Figure A1. Calibration data for the 3068B FCAE. Upper panel shows percent residuals.
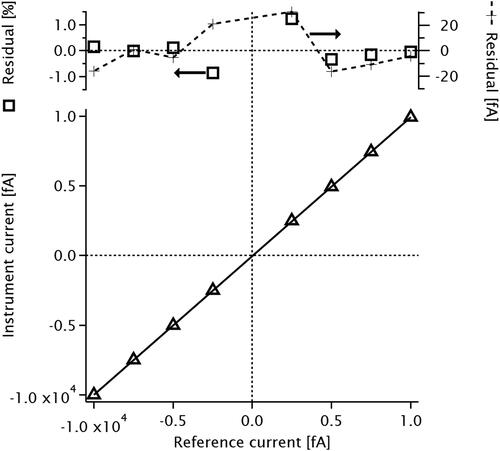
Figure A2. Allan variance plots of the previous FCAE (Keithley-plus-in-house FCAE) and TSI 3068B FCAE configurations. The sample data represent multiple hours of measurements on filtered laboratory air. The maximum Allan variance, up to 120 min, is much smaller than the electrometer calibration uncertainties shown in .
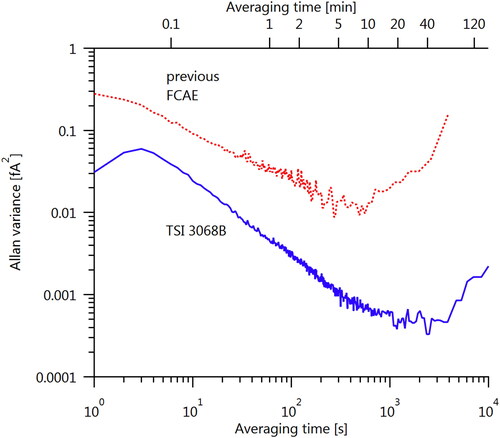
Figure A3. Calculated uncertainties in mass concentration due to FCAE uncertainties according to EquationEquation (A1)(A1)
(A1) for a range of FCAE flows and CPMA setpoints.
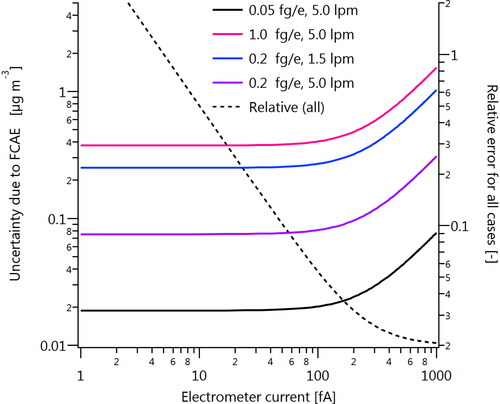
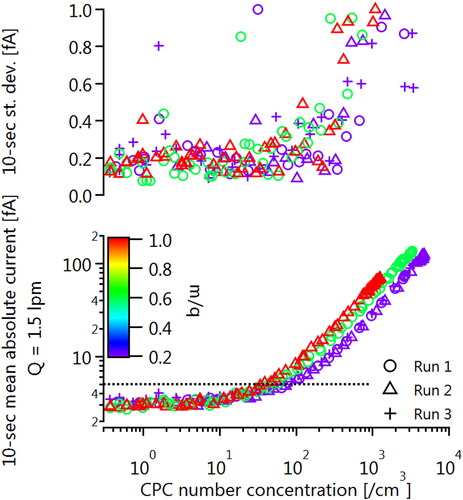
Figure A4. Linearity of electrometer response demonstrated with a CPC for various setpoints at the CPMA. The background signal of about 3 fA was not subtracted from the FCAE data to better illustrate the trends.