Figures & data
Figure 1. Aerosol particle mass emission rates during different exercises (dark blue, left y-axis), and the average number of droplets per frame (from image analysis, see ) in the exhaled air during the same exercises (red, right y-axis). Particle mass was measured in the range 0.5–10 µm. Each blue box represent data for 12 singers for aerosol particles and 5 singers for droplets. Two high values for loud singing not shown.
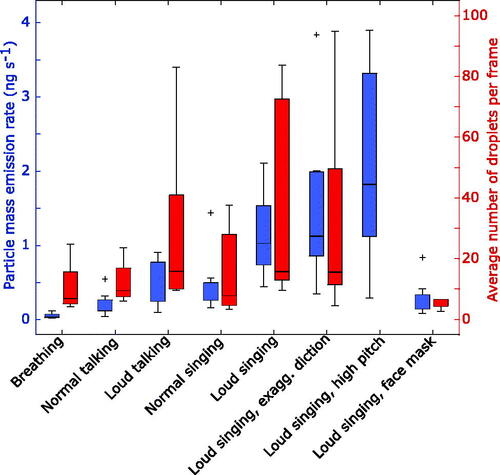
Figure 2. Median number of emitted particles in the size range 0.54–10 µm per second for the 12 singers.
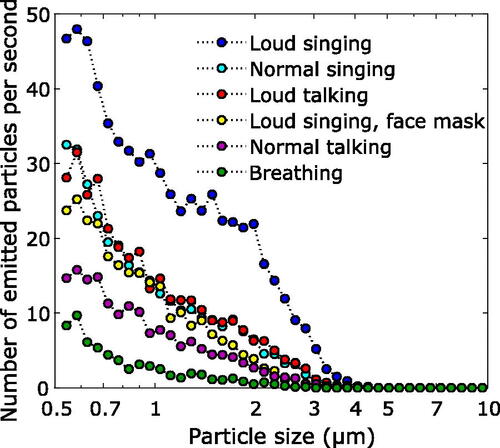
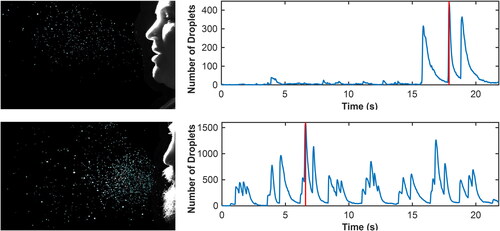
Figure 3. The number of droplets per picture frame generated during loud singing with exaggerated consonants by the professional opera singers. During the 20 s the same phrase is repeated twice. Videos are available in the online supplementary information.