Figures & data
Figure 1. Pictorial depiction of TracB device. (a) Side view of the device (L-21 cm, H-8.5 cm, W-11 cm) with aerosol sensing component at the top and electrostatic precipitator at the bottom, (b) the aerosol sensing components include, 1 – two cooling fans (25 × 25 × 10 mm), 2 – air ionizer modules used as a HV source and as a particle ionizer in the electrostatic precipitator, 3 – power board that splits the input DC voltage to the air quality sensor and other electronic components, 4 – plantower air quality sensor, 5 – a circuit board that regulates the operation of a temperature sensor, RH sensor, Wi-Fi chip, real time clock chip, SD card slot, and a plantower power chip, (c) isometric view of the device shown with the fan side of the face, and a 12 V DC input socket can be seen present at the upper right hand side of the device, and (d) schematic representation of the side view of the electrostatic precipitator situated at the bottom of the device. The mixture of biological particles entering the device gets ionized with positive charges at the ionization region followed by their precipitation on the ground plate under an electric field of 8 kV/cm.
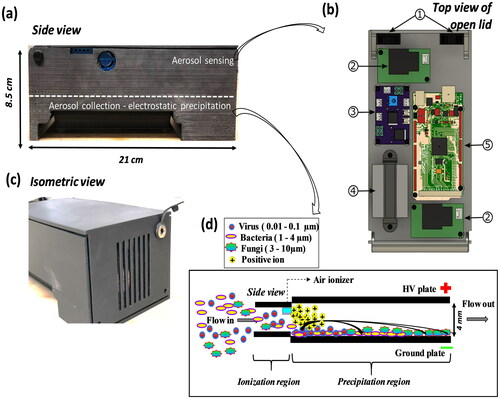
Figure 2. Schematic representation of the position of air ionizer in the device. Perpendicular (indicated as Y; a, b) and parallel (indicated as X; c, d) orientation of the ionizer in the precipitator region is shown. Red arrows in (b) and (d) indicate the respective ionizer’s orientation.
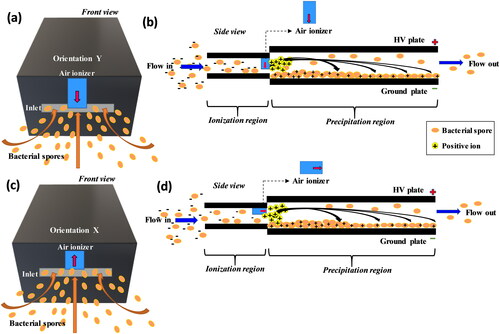
Figure 3. Experimental setup for evaluating the aerosol collection by TracB device. A nebulizer (a) and a dust feeder (b) were used to generate aerosol of bacteria and dust particles, respectively. A neutralizer was introduced for charge conditioning, along with a diffusion dryer for the removal of excess water droplets from the bacterial aerosol particles. TracB device situated inside the drum was operated with a 12 V DC power supply. The particle concentration inside the drum was continuously monitored by an APS, and an additional dilution air flow to the drum allowed the particles to attain faster equilibrium prior to the start of the experiment. Exemplary images depicting the Btk spores (dashed red box; c) and the particle collection in the precipitator region of the device (d) is shown on the right-hand side of the diagram.
Figure 4. Effect of external ionization on the biological (Btk) and nonbiological (dust) particle collection in the device. Collection efficiency was tested for two operating conditions of “ionizer on” and “ionizer off.” The experiments were performed at a fixed flow rate of 10 lit/min and for a collection voltage of 5 kV. Each data point in the figure is an average from the triplicate experimental dataset and the error bars represent standard deviations.
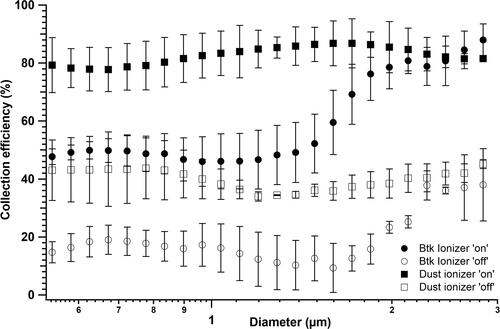
Figure 5. Collection efficiency of TracB determined as a function of Btk aerosol concentration. Independent set of experiments were performed with Btk spore and cell suspension, each varying in concentration as 103, 106, and 108/mL. Upon nebulization, the corresponding aerosol concentration,10°, 102, and 103 #/cm3 was achieved. The device was operated at a flow rate of 10 lit/min, a precipitation voltage of 5 kV, and with the low-cost ionizer positioned perpendicular to the particle flow. The error bars represent the standard deviation for three repeats.
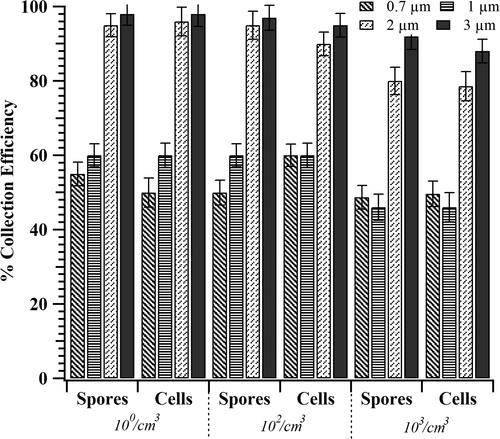
Figure 6. Collection efficiency of spores when the ionizers were placed parallel (X), and perpendicular (Y) to the air flow. The experiments were performed with the spores at a concentration of 102/cm3 at a fixed flow rate of 10 lit/min and at a precipitation voltage of 5 kV. Data represents the average of three replicates with the error bars representing the standard deviation.
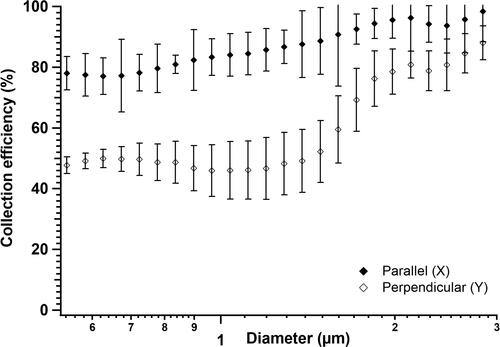
Figure 7. (a) Schematic showing side view of the TracB and the top view of velocity distribution in the bottom plane of the device simulated when the ionizer was placed, (b) perpendicular, and (c) parallel to the flow field. The color scale for (b) and (c) indicates the velocity values ranging from 0 to 0.6 m/s. The corresponding particle collection trajectories of 1 µm particles for perpendicular and parallel orientations are represented as side view (d) and (e), respectively. Top view of the particle collection shown in (f) and (g) corresponds to the planes of d and e as indicated by dashed arrows. Black rectangular areas in the figures represent the ionizer. The point where the particle lines end indicates the location where the particles are collected on the ground plate.
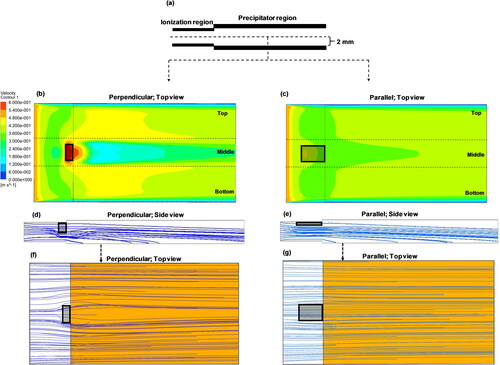
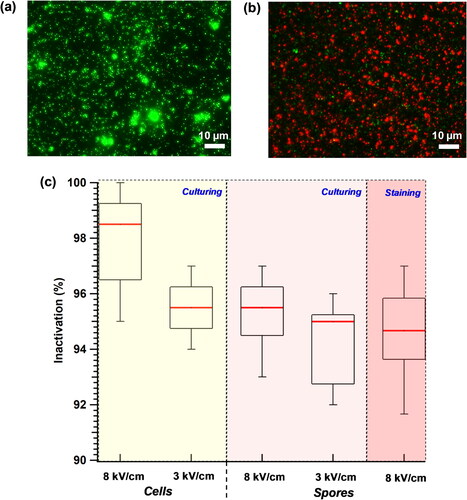
Figure 8. Electrostatic-precipitation-induced inactivation of the Btk spores and cells. The device was operated at 10 lit/min and the effect of two precipitation electric fields, 8 and 3 kV/cm, was tested for bacterial inactivation (%). Live-dead staining was performed with the Btk spores collected on the ground plate (102/cm3) using acridine orange (green, stains live cells) and propidium iodide (red, stains dead cells). Representative images depict (a) the live bacteria (stained green) and (b) the dead bacteria (stained red) from the 8 kV/cm electric field exposure. (c) Box and whisker plot depict the quantification of cell and spore inactivation (%) as a function of electric field, estimated from independent staining and the culturing experiments. The black rectangle in the box plot represents the interquartile range, the red line indicates the median inactivation %, and the 10th and 90th percentile values are indicated by the whiskers.