Figures & data
Table 1. Summary of fabrication parameters in previous studies.
Figure 1. Schematic diagram of the electrospinning equipment.
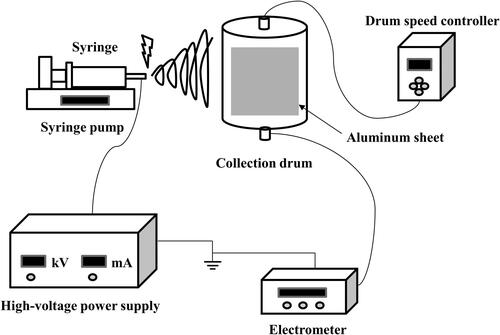
Table 2. Experimental conditions for test filters produced by electrospinning.
Figure 2. Experimental set-up for measuring filtration performance.
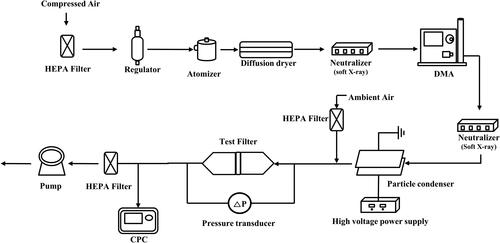
Figure 3. Viscosity of the PVA solution at different concentrations and molecular weights.
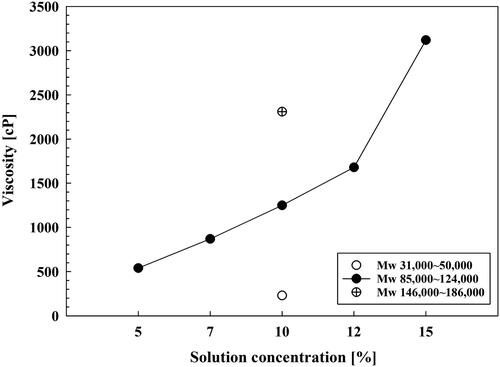
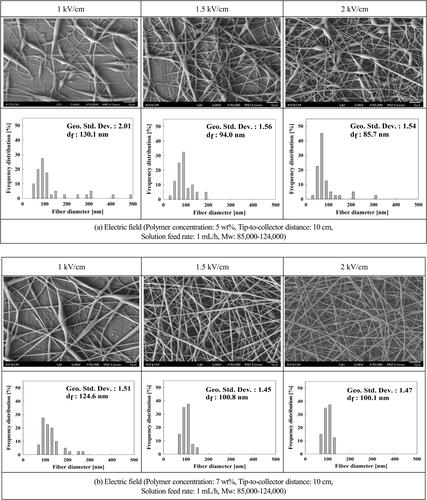
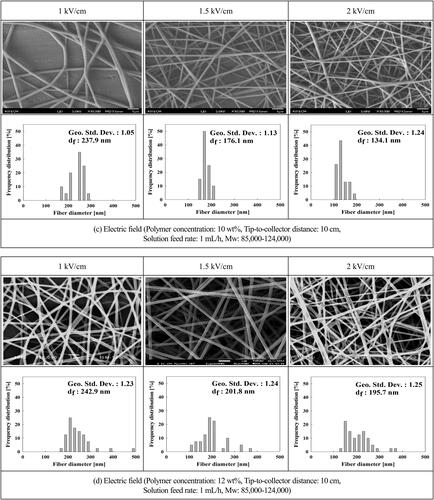
Figure 5. FE-SEM images and fiber diameter distributions of electrospun filter media at various molecular weights ((a) Mw: 31,000-50,000, (b) Mw: 85,000-1240,000, (c) Mw: 146,000-186,000).
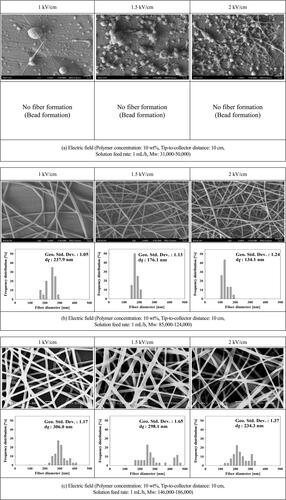
Figure 6. FE-SEM images of electrospun filter media with same physical properties aside from different fiber diameters.
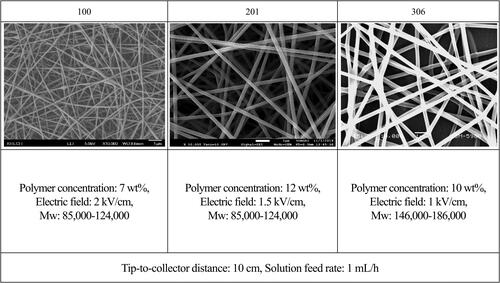
Table 3. Physical properties of the test filters’.
Figure 7. Pressure drops of the PVA nanofiber filters and comparison of experimental data with results predicted by the proposed equation.
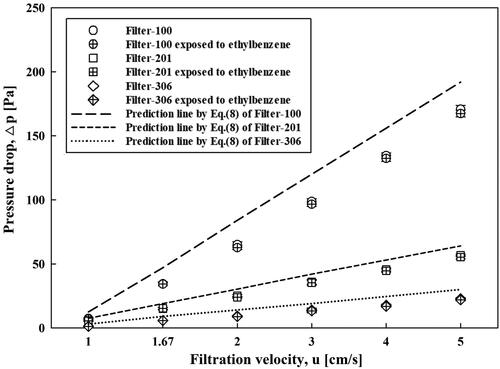
Figure 8. Collection efficiencies of PVA nanofiber filters and comparison of experimental data with results predicted by the proposed equation.
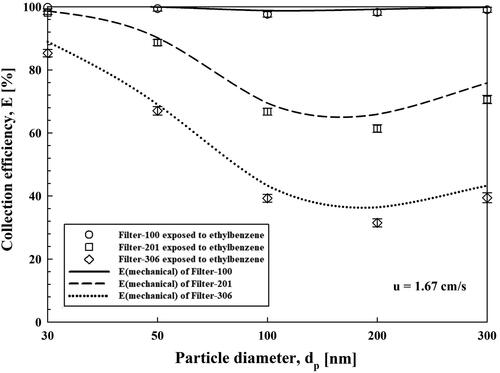
Figure 9. Filter quality factors of the PVA nanofiber filters and comparison of experimental data with results predicted by the proposed equations.
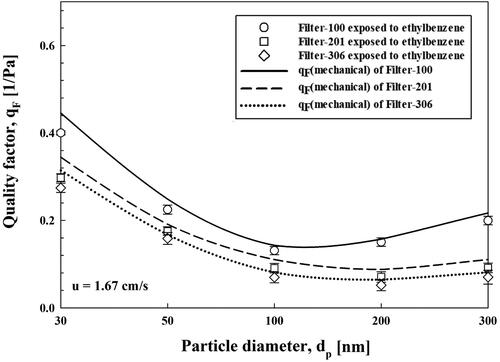
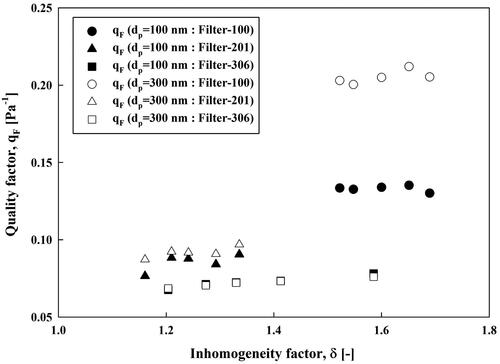
Figure 10. The relationship between inhomogeneity factor of the filters and filter quality factors.