
Figures & data
Figure 1. Schematic of rotating drum aerosol chamber. A 16-L environmentally controlled rotating drum aerosol chamber was used to assess the effect of environmental parameters on the decay rate of SARS-CoV-2. The temperature of the air inside the chamber was controlled by adjusting the temperature of polypropylene glycol circulating through the walls of the chamber. The humidity inside the chamber was controlled by varying the mix of dry and humid air used to supply the chamber during aerosol filling and sampling. Simulated sunlight was introduced into the chamber through a quartz glass window located on one end of the chamber, as indicated by the arrows in the figure. Aerosols with a target MMAD of 2 µm were generated with an air assist nozzle into a humidity controlled stainless steel plenum that was exhausted through a HEPA filter. A portion of this flow was diverted into the rotating drum for 20–30 s during filling to achieve a quantifiable concentration of infectious virus. Multiple samples were collected over the duration of the test to estimate infectious viral concentrations and total aerosol mass concentrations over time from sampling ports located on a non-rotating band in the wall of the rotating drum.
Figure 2. Comparison of simulated sunlight UV spectrum to NCAR TUV model spectrum. The spectrum generated by the solar simulator (black) was similar to that predicted by NCAR’s TUV radiation model for 40°N latitude on 21 June at noon at sea level under cloudless conditions (gray). Integrated UVB irradiances were 1.91 W/m2 and 1.84 W/m2 for the solar simulator and TUV radiation model, respectively. No irradiance above the background level of the spectroradiometer measured in darkness (dashed line) was present in the spectrum generated by the solar simulator below approximately 295 nm.
Figure 3. Representative decay plots. The slopes of the best fit lines for time-series log10-transformed infectious and mass aerosol concentrations from each test were used as estimates of the total and physical decays, respectively. Total decay rates calculated from filter samples were normalized for physical losses by subtracting the physical decay rate calculated from APS samples to estimate the decay rate for viral infectivity. Decay plots from tests at (a) 30 °C, 1.9 W/m2 integrated UVB, and 20% relative humidity and (b) 10 °C, 0.0 W/m2 integrated UVB, and 70% relative humidity are shown. The decay rate for viral infectivity is greater for (a) 30 °C, 1.9 W/m2 integrated UVB, and 20% relative humidity relative to (b) 10 °C, 0.0 W/m2 integrated UVB, and 70% relative humidity, as can be seen from the larger difference between the slopes of viral (black) and mass (gray) aerosol concentrations.
Figure 4. Decay constants for viral infectivity as a function of temperature and humidity without simulated sunlight. Both relative and absolute humidity levels are shown on the x-axis, along with temperature. Decay constants were near zero for most conditions, but increased at both 40 °C/20% relative humidity and 30 °C/70% relative humidity. Lines indicate arithmetic mean ± one standard deviation.
Figure 5. Decay constants for viral infectivity as a function of temperature and humidity at 0.9 W/m2 UVB irradiance. Both relative and absolute humidity levels are shown on the x-axis, along with temperature. Lines indicate arithmetic mean ± one standard deviation. Data at 20 °C and 45% relative humidity are from Schuit, Ratnesar-Shumate, et al. (Citation2020).
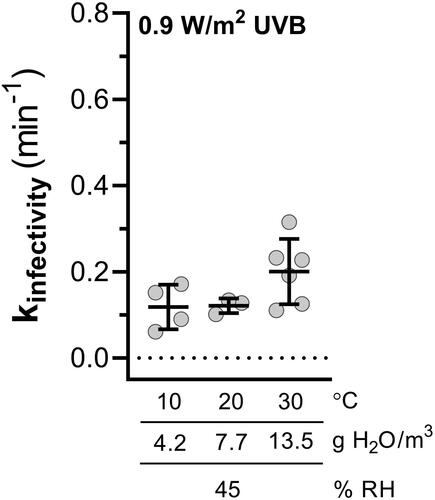
Figure 6. Decay constants for viral infectivity as a function of temperature and humidity at 1.9 W/m2 UVB irradiance. Both relative and absolute humidity levels are shown on the x-axis, along with temperature. Lines indicate arithmetic mean ± one standard deviation. Data at 20 °C and 20% relative humidity are from Schuit, Ratnesar-Shumate, et al. (Citation2020). The variability associated with measurement of kinfectivity was significantly increased relative to measurements at lower simulated sunlight levels, especially at higher relative humidities.
Table 1. Decay as function of environmental conditions. Mean decay constants and decay rates are shown for each combination of environmental conditions evaluated. Values are presented as arithmetic mean ± one standard deviation. *Denotes data reported in Schuit, Ratnesar-Shumate, et al. (Citation2020).
Table 2. Standardized Coefficients for Regression Analyses Peformed with Relative Humidity or Absolute Humidity. Comparison of the standardized coefficients allow the magnitude of the effect of each parameter to be directly compared. For the range of environmental conditions tested, sunlight had the greatest influence on the decay constant for infectivity in either model, followed by temperature and their interaction. Humidity, regardless of whether it was expressed as relative or absolute humidity, had the smallest influence on the decay constant for infectivity. Best fit values are presented with 95% confidence intervals for each coefficient in parentheses underneath.