
Figures & data
Table 1. Test vehicle characteristics.
Figure 1. Chassis dynamometer measurement layout with the sampling system at the exhaust tailpipe. An AVL PN PEMS (SPN>23nm) was in parallel connected to the tailpipe. Notes: MFC: Mass Flow Controller, VPR: Volatile Particle Remover, ED: Ejector Diluter.
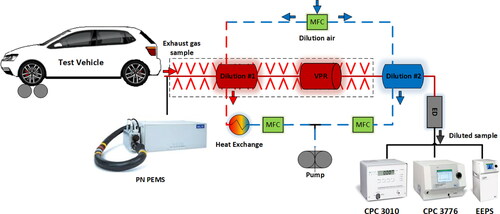
Figure 2. Aggregated SPN emissions for gasoline (light yellow background) and CNG (light green background). Error bars show the standard error of the mean, including 2 to 4 repetitions. Emission bars with no error bar indicating a unique measurement.
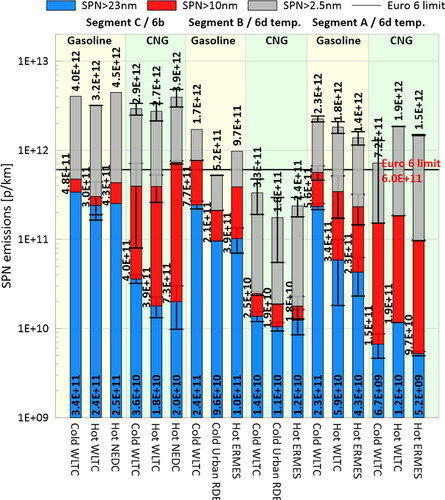
Figure 3. SPN emission results with respect to the particle limit level. Horizontal axis: Relative emissions of SPN>23nm over limit level. Vertical axis: Relative emissions of SPN>10nm or SPN>2.5 nm over limit level. Left-side graphs refer to Euro 6b, right-hand graphs refer to Euro6d-temp vehicles. Triangle marks refer to CNG, and square ones refer to gasoline. Each color represents a different vehicle segment, while hatched and non-hatched symbols represent SPN>2.5 nm and SPN>10nm, respectively.
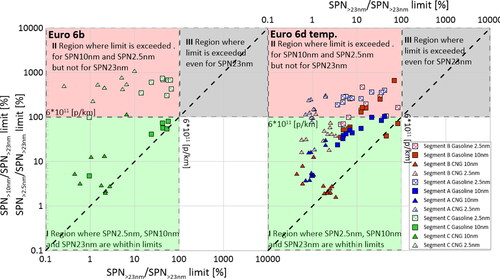
Figure 4. Average PSD profiles recorded with EEPS during WLTC Hot testing. Levels within the red area are considered to be below the instrument sensitivity. Left: Euro 6 b Segment C vehicle; Right: Segment A and B Euro 6d-temp vehicles.
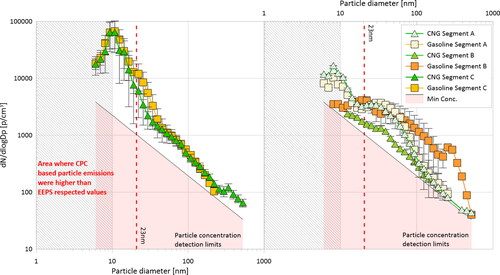
Figure 5. Particle size distribution for both fuels under steady state operation at 80 km/h. Measurements were performed with SMPS nano-DMA with three repetitions for each vehicle and fuel combination. The upper right sub-graph presents the average GMD for each fuel.
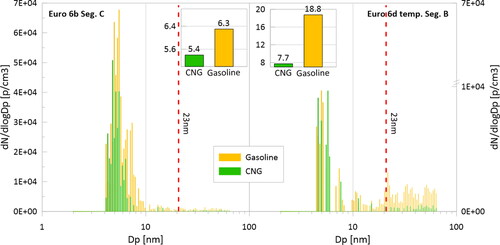
Figure 6. Instantaneous SPN>2.5 nm emissions of CNG and gasoline engine operation of the Euro 6 b Segment C vehicle during an excerpt of cold WLTC.
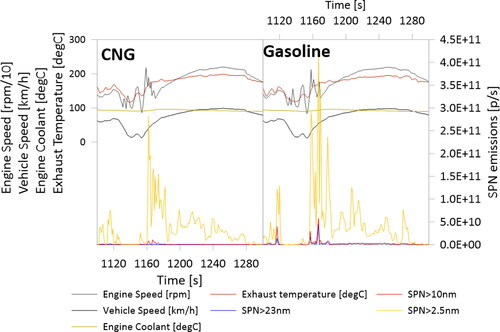
Figure 7. Particle emission performance with respect to engine operational characteristics of the Segment C vehicle as an example.
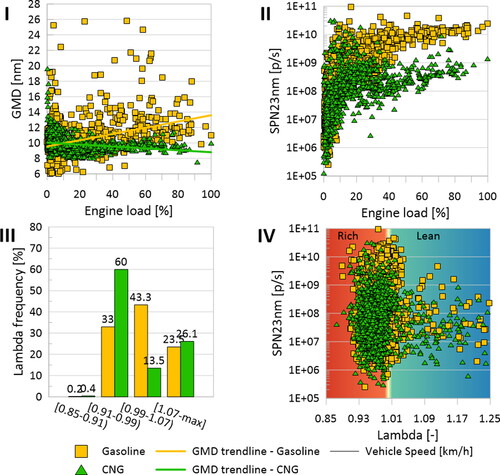
Table 2. Technical characteristics of particle detection instrumentation.