
Figures & data
Figure 1. Diagram of the test duct used in experiments, based from the ASHRAE Standard 52.2. Locations on the diagram show the approximate placement of the injection location, sampling location, and filters.
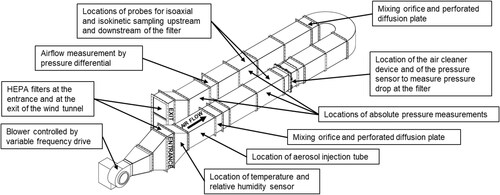
Table 1. Airflow and environmental conditions inside the test duct during ELPI measuring and sampling of artificial viral aerosols.
Figure 2. Preservation of infectivity of PhiX174 and MS2 phages with test dust and cryoprotectants after lyophilization. The quantification of PhiX174 (a) and MS2 (b) phages with test dust and cryoprotectants was done before and after lyophilization. All tested mixture contained 25 g of test dust, 10 ml of phage suspensions and a cryoprotective agent for a total volume of 20 ml. Bars are averages of replicates (n = 3, except for 0.1 M sucrose of MS2 before lyophilization n = 1) with standard error of the mean. * indicates a result below the detection limit.
Figure 3. TEM imaging of lyophilized mixture of MS2 phages – ISO 12103-1 A3 medium test dust. (a) An aggregation of MS2 phages and fine dust particles indicated by the faint shading around the aggregate. (b) A larger dust particle bearing MS2 phages. (c) A broad view of MS2 phages associating with dust particles and existing potentially independently. (d) A closer image of the large aggregate at the top left in (c).
Figure 4. The total number of dust particles by ELPI stage. The ELPI stages are indicated along the x-axis. Two replicates (hollow and solids) were done on each sampling days, 7 June (● and ^) and 27 September (▪ and □). X-axis stage size indicates the approximate geometric midpoint, minor variations were noted between the two columns used to collect air samples, Table S1. Error bars are from the varying counts by the ELPI during sampling.
Figure 5. Total MS2 phages (copies) per cm3 of air per stage of ELPI. The ELPI stages are indicated along the x-axis. Two replicates (hollow and solids) were done on each experimental day, 7 June (● and ^) and 27 September (▪ and □). X-axis stage size indicates the approximate geometric midpoint, minor variations were noted between the two columns used to collect air samples, Table S1. Error bars represent the error from the qPCR replicates.
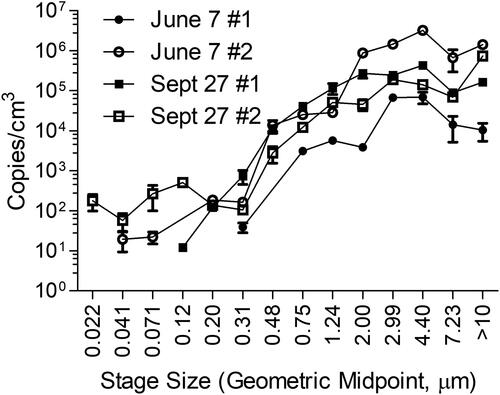
Table 2. Airflow and environmental conditions inside the test duct during the challenge of MERV-16 and antimicrobial filters with artificial viral aerosols. Values are averages of the recordings on each experimental day. The amount (kg) of phages – test dust aerosolized on average per day is indicated in the “Weight” column.
Table 3. Reduction efficiencies of MERV-16 and antimicrobial filters against dust particles, and infectious (culture) and total (qPCR) MS2 phages when challenged with the artificial viral aerosols.