Figures & data
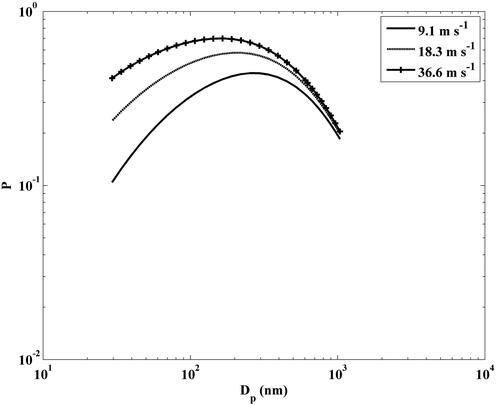
Figure 1. Scanning electron microscope (SEM) picture of (a) 10 oz Denim and (b) A30.
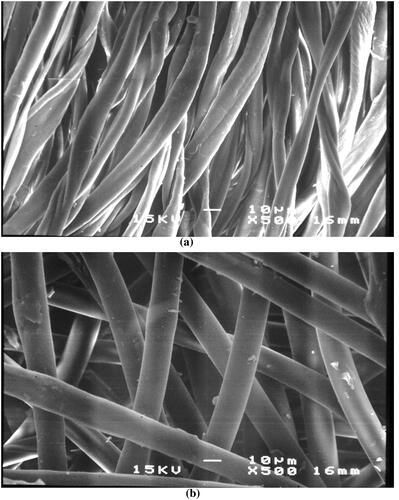
Figure 2. Experimental setup: (a) benchtop and (b) sleeve configurations.
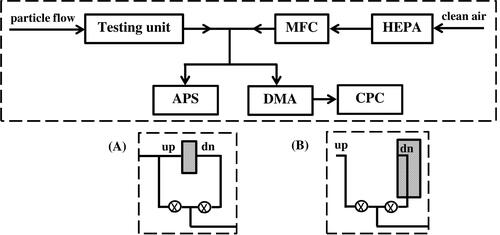
Table 1. Fabric parameters obtained from measurements and optimization.
Table 2. Face velocity and pressure drop across the media.
Figure 3. Particle penetration over denim under (a) varying face velocity for benchtop test and (b) constant 18.3 m s−1 free stream wind speed with different sampling azimuth during sleeve test.
Figure 4. Maximum penetration particle size (MPPS) vs. face velocity.
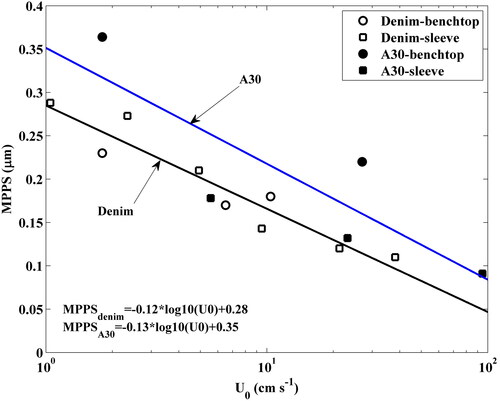
Figure 5. The correlation of Lee and Liu (Citation1982) in EquationEquation (3)(3)
(3) compared with experimental results using denim and optimized fiber parameters.
![Figure 5. The correlation of Lee and Liu (Citation1982) in EquationEquation (3)(3) ηPeR1+R=1.6[(1−αKu)13Pe13]+0.6[(1−αKu)13Pe13]3(3) compared with experimental results using denim and optimized fiber parameters.](/cms/asset/1bb72d07-277f-4925-9063-046585b262c7/uast_a_1845297_f0005_b.jpg)
Table 3. Optimized geometric standard deviation of packing density obtained using inhomogeneous filtration theory.
Figure 6. Measured and theoretical penetration from benchtop setup: (a) denim 1.8 and 6.5 cm/s; (b) denim 10.4 and 27 cm/s; (c) A30 1.8 and 6.5 cm/s; and (d) A30, 10.4 and 27 cm/s.
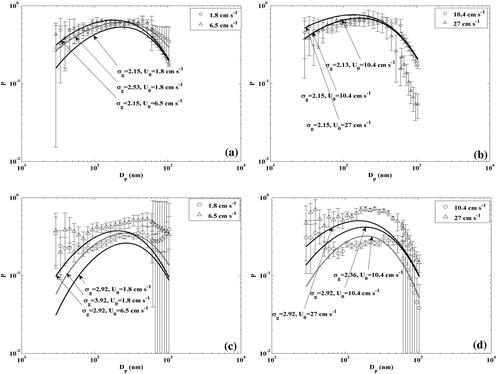
Table 4. Weighted error, between the experiment measurements and theoretical predictions.
Figure 7. Measured and theoretical penetration from sleeve setup: (a) denim 3.0 and 9.1 m/s; (b) denim 18.3 and 36.6 cm/s; (c) A30 3.0 and 9.1 cm/s; and (d) A30, 18.3 and 36.6 cm/s.
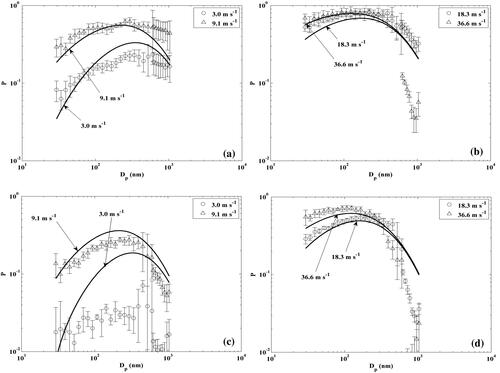
Figure 8. Measured and theoretical penetration for the combination of denim and A30: (a) benchtop 1.8 and 6.5 cm/s; (b) benchtop 10.4 and 27 cm/s; (c) sleeve 9.1 m/s; and (d) sleeve 18.3 and 36.6 m/s.
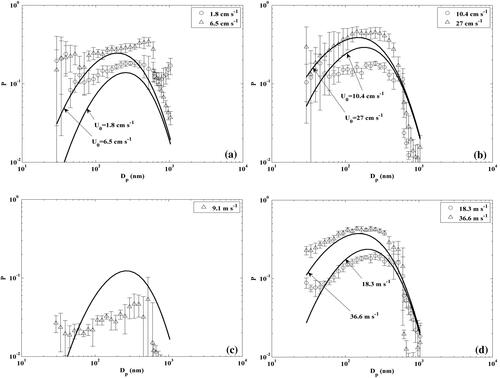
Figure 9. Normalized pressure drop for 10 oz denim vs. separation angle.
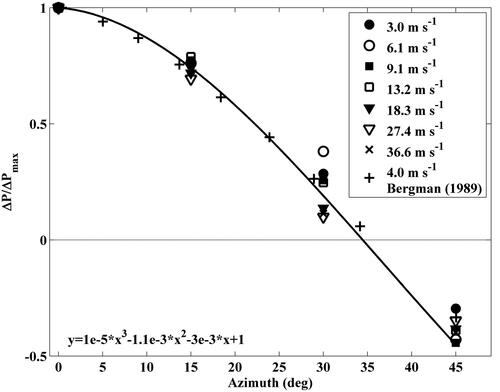
Figure 10. Measured and theoretical penetration for denim with sleeve setup at 15° and 30° under free stream velocity: (a) 9.1 m/s and (b) 36.6 m/s.
Figure 11. Predicted net penetration through 10 oz denim sleeve based on the optimized parameters and inhomogeneous filtration theory.