Figures & data
Figure 1. The time series of background-subtracted PNC at three locations, 0.3, 0.9, and 1.8 m away from the volunteer at condition #1 no face covering.
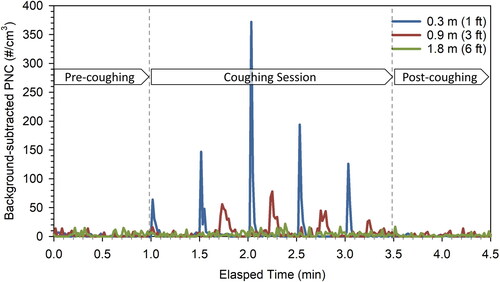
Table 1. Characteristics of the seven face covering conditions.
Figure 2. Background-subtracted PNCs at 0.3, 0.9, and 1.8 m away from the volunteer under #1 no face covering condition and #2-10 face coverings conditions. Error bars show the standard error of the mean. The Mann-Whitney U test was used to compare the PNC during coughing vs. background level. *p ≤ 0.05, **p ≤ 0.01, ***p ≤ 0.001.
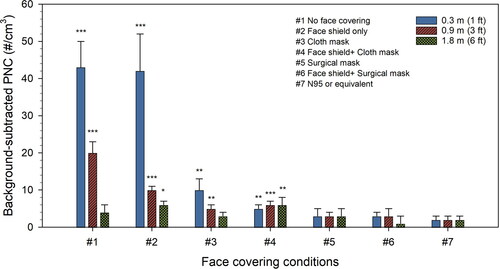
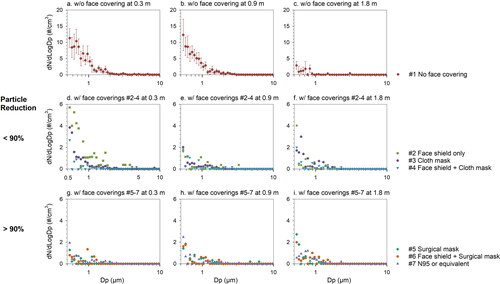
Figure 3. Background-subtracted particle size distributions of cough-generated airborne particles under different face covering conditions at 0.3, 0.9, and 1.8 m away from the volunteer. Error bars show the standard error of the mean. Please note different scale on Y-axis.