Figures & data
Figure 1. Schematic diagram of the particle sizing system. When the puff flow (B) is toggled off by a solenoid valve, flow (A) is generated at the EC port to create a puff on the EC. The makeup flow (C) is set to maintain the total flow into the impactor (flows C + (B or A)) equal to the flow out of the impactor flow (D).
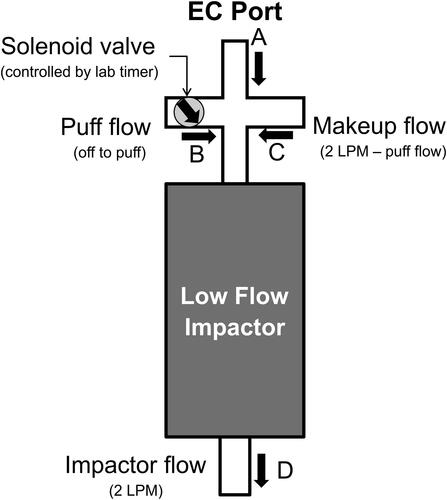
Figure 2. Examples of particle size distributions of (a) reference cigarette 3R4F (one puff of 35 mL and 2 s duration) and (b) EC (five puffs of 55 mL and 5 s duration, each) measured with the impactor. Both graphs are data from a single measurement, but representative of the typical histograms.
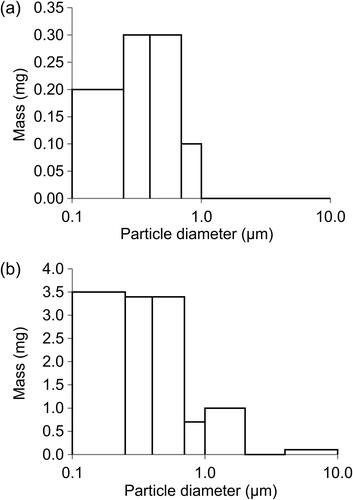
Figure 3. Mass recovery in the cascade impactor for the commercial products described in Section 2 puffed under similar conditions (i.e., 55 mL, 5 s puffs). The error bars represent ±1 standard deviation of three or four successive measurements on one device. The dotted line represents 100% recovery.
Figure 4. Effect of puff count on the measured MMAD. The error bars represent ±1 standard deviation of three independent measurements.
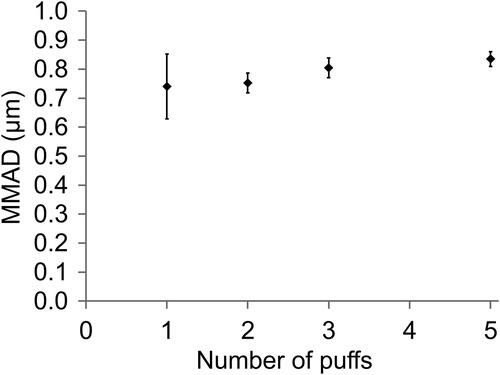
Figure 5. Effect of the puff flow rate on the aerosol MMAD. The error bars represent ±1 standard deviation of 3–5 measurements.
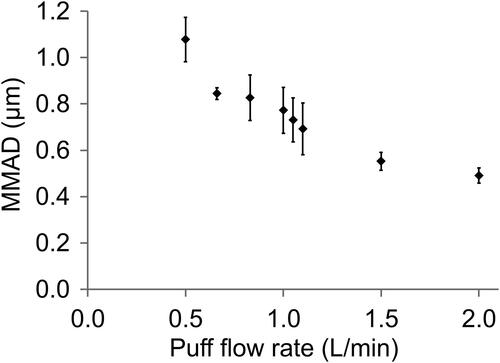
Figure 6. Comparison of particle size of different ECs. The error bars represent ±1 standard deviation of three independent measurements.
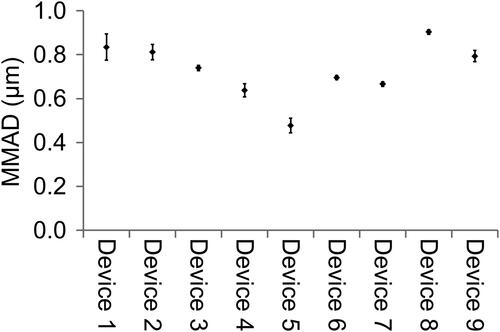
Figure 7. MMAD of different electronic cigarettes compared to mass delivery. The error bars represent ±1 standard deviation of three independent measurements. The dotted line in the graph is the model prediction given by EquationEquation (1)(1)
(1) .
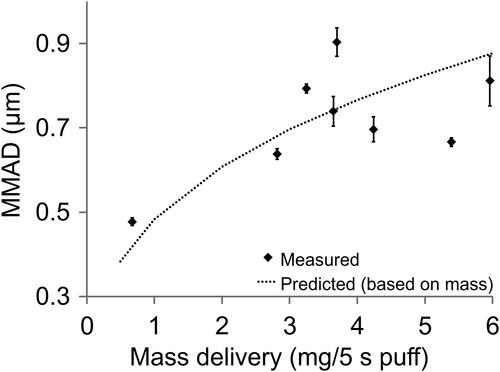
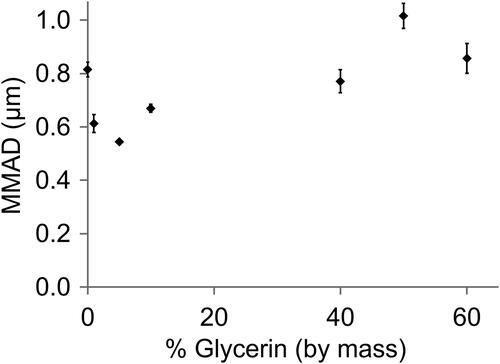
Figure 8. Dependence of the particle size on the carrier composition. The error bars represent ±1 standard deviation of 3 independent measurements.