Figures & data
Figure 1. A schematic plot of the experimental setup and measurement instruments.
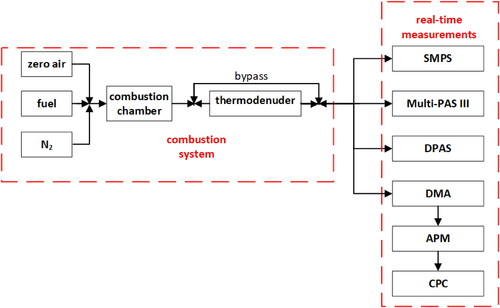
Table 1. Specifications of Multi-PAS III and RGB-DPAS photoacoustic instruments.
Figure 2. Comparison of the AAE values obtained from the Multi-PAS III and normalized equivalence ratio. Symbols are colored by Multi-PAS III measured absorption coefficient at 532 nm (babs,532,Multi-PAS III). Error bars represent measurement uncertainties (see Uncertainty Analysis in SI).
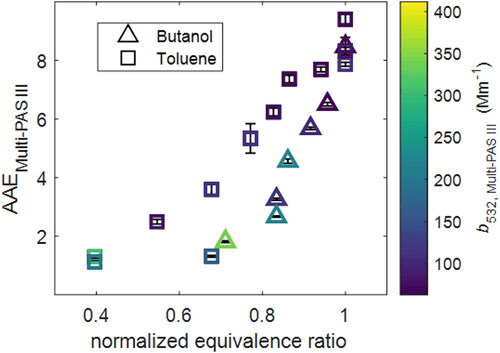
Figure 3. Comparison of the measured absorption coefficients from the Multi-PAS III and single-pass RGB-DPAS. Black dotted line is 1:1 reference line. The Purple dotted line is the linear fitting (babs,532,RGB-DPAS = 1.005 babs,532,Multi-PAS III, R2 = 0.9437). Symbols are colored by Multi-PAS III measured AAE (AAEMulti-PAS III). Error bars represent measurement uncertainties (see Uncertainty Analysis in SI).
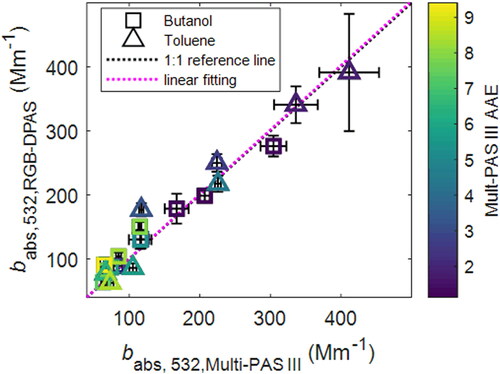
Figure 4. Comparison of the AAE values obtained from the Multi-PAS III and single-pass RGB-DPAS. Black dotted line is 1:1 reference line. The Purple dotted line is the linear fitting (AAERGB-DPAS = 1.021 AAEMulti-PAS III, R2 = 0.9171). Symbols are colored by Multi-PAS III measured absorption coefficient at 532 nm (babs,532,Multi-PAS III). Error bars represent measurement uncertainty (see Uncertainty Analysis in SI).
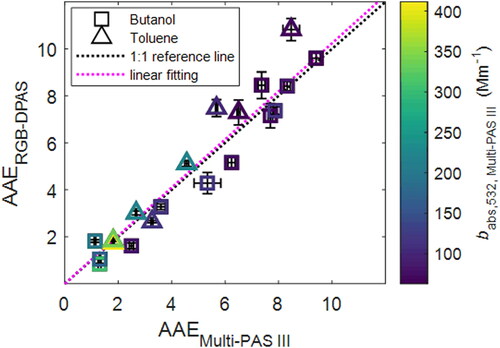
Figure 5. Comparison between measured and predicted the absorption coefficients at (a) 422 nm and (babs,422,Multi-PAS III) and (b) 781 nm (babs,781,Multi-PAS III) for Multi-PAS III, and (c) 473 nm (babs,473,RGB-DPAS) and (d) 671 nm (babs,671,RGB-DPAS) for RGB-DPAS. Predicted absorption coefficients at each wavelength for Multi-PAS III or RGB-DPAS are calculated using obtained the absorption coefficients at 532 nm on the instrument and the AAE values of the other instrument (e.g., babs,Multi-PAS III (λ) = babs,532,Multi-PAS (532/λ)AAERGB-DPAS). Black dotted line is 1:1 reference line. The Purple dotted line is the linear fitting [(a) babs,Multi-PAS III,422,predicted = 0.9838 babs,Multi-PAS III,422, R2 = 0.8493; (b) babs,Multi-PAS III,781,predicted = 0.8761 babs,Multi-Pas III,781, R2 = 0.9580; (c) babs,RGB-DPAS,473,predicted = 0.9722 babs,RGB-DPAS,473, R2 = 0.8923; (d) babs,RGB-DPAS,671,predicted = 0.9547 babs,RGB-DPAS,671, R2 = 0.9921]. Symbols are colored by Multi-PAS III measured AAE (AAEMulti-PAS III). Error bars represent measurement uncertainties (see Uncertainty Analysis in SI).
![Figure 5. Comparison between measured and predicted the absorption coefficients at (a) 422 nm and (babs,422,Multi-PAS III) and (b) 781 nm (babs,781,Multi-PAS III) for Multi-PAS III, and (c) 473 nm (babs,473,RGB-DPAS) and (d) 671 nm (babs,671,RGB-DPAS) for RGB-DPAS. Predicted absorption coefficients at each wavelength for Multi-PAS III or RGB-DPAS are calculated using obtained the absorption coefficients at 532 nm on the instrument and the AAE values of the other instrument (e.g., babs,Multi-PAS III (λ) = babs,532,Multi-PAS (532/λ)AAERGB-DPAS). Black dotted line is 1:1 reference line. The Purple dotted line is the linear fitting [(a) babs,Multi-PAS III,422,predicted = 0.9838 babs,Multi-PAS III,422, R2 = 0.8493; (b) babs,Multi-PAS III,781,predicted = 0.8761 babs,Multi-Pas III,781, R2 = 0.9580; (c) babs,RGB-DPAS,473,predicted = 0.9722 babs,RGB-DPAS,473, R2 = 0.8923; (d) babs,RGB-DPAS,671,predicted = 0.9547 babs,RGB-DPAS,671, R2 = 0.9921]. Symbols are colored by Multi-PAS III measured AAE (AAEMulti-PAS III). Error bars represent measurement uncertainties (see Uncertainty Analysis in SI).](/cms/asset/35b0a69e-145c-4db8-ab8b-f04eeb13eee5/uast_a_1849537_f0005_c.jpg)
Figure 6. Calibration of the Multi-PAS III instrument with NO2 and air-borne Cab-O-Jet aerosols. Y axis represents the obtained normalized signal responses (microphone signal/photodiode signal). X axis represents the expected light absorption coefficient.
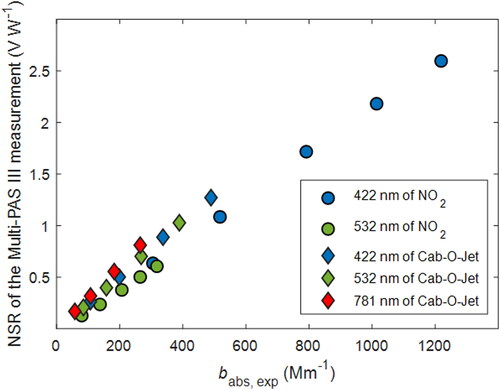
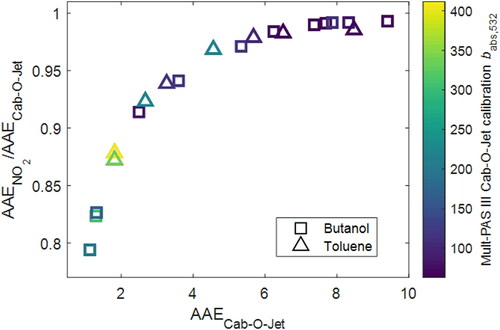
Figure 7. Comparison of carbonaceous aerosol AAE values retrieved from the Multi-PAS III measurements based on NO2 calibration and those based on Cab-O-Jet calibration. Symbols are colored by babs,532 values measured by the Multi-PAS III based on Cab-O-Jet calibration. Error bars represent measurement uncertainties (see Uncertainty Analysis in SI).