Figures & data
Table 1. Specifications of the tested low-cost monitors.
Figure 1. Experimental setup in Aerosol Exposure Chamber at CH Technologies Inc. (Westwood, NJ, USA). For illustration purposes only.
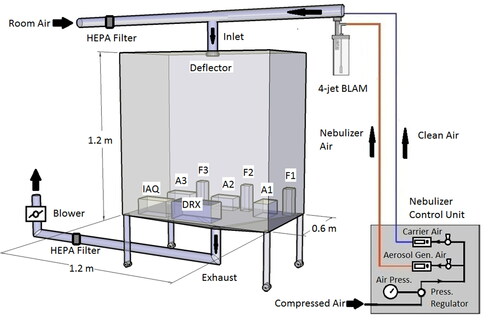
Figure 2. Experimental setup in the Controlled Exposure Facility (CEF) at Rutgers Environmental and Occupational Health Sciences Institute (EOHSI).
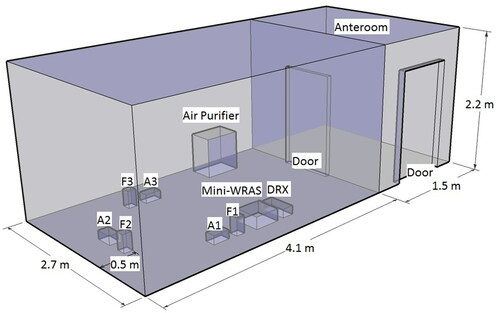
Figure 3. Experimental setup for indoor testing of low-cost monitors during cooking.
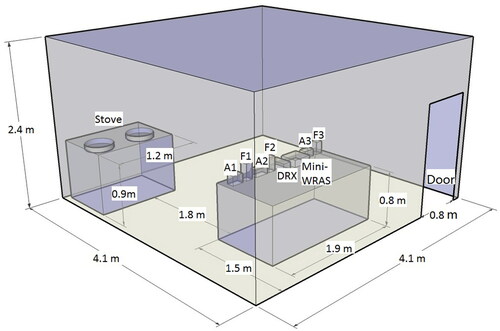
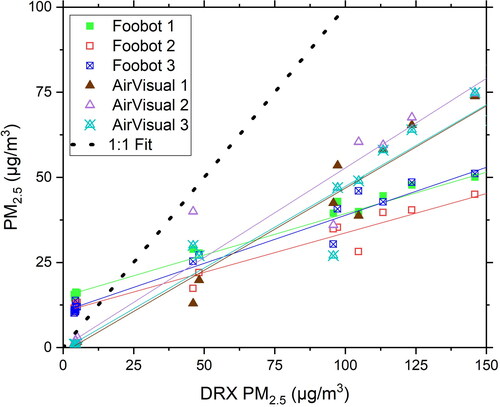
Figure 4. Performance of low-cost monitors in the Aerosol Exposure Chamber when measuring different particles: (a) 0.72 μm PSL, (b) 2 μm PSL, (c) Arizona Road Dust (ARD).
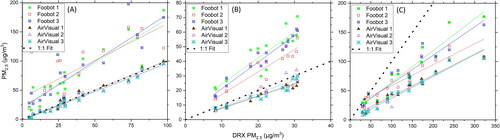
Table 2. Summary of Pearson correlation coefficients (r) and linear regression parameters (intercept value, slope coefficient, and coefficient of determination R2) for the 5 min average PM2.5 concentrations measured by Foobot and AirVisual units compared to TSI DRX, when challenged with 0.72 µm and 2 µm Polystyrene Latex (PSL) spheres and Arizona Road Dust (ARD) (measurements in Aerosol Exposure Chamber [AEC]), nano-silver spray (measurements in the Controlled Exposure Facility), and particles resulting from cooking (measurements in an indoor environment).
Table 3. The precision error of paired monitor.
Table 4. The coefficient of variation, CV (%), for Foobot and AirVisual when challenged with different aerosols.
Table 5. The p-values resulting from the paired t-test of sensor pairs. *Significant difference (p ≤ 0.05).
Figure 5. The size distribution of particles produced by nano-silver spray and a cooking event as measured by Grimm Aerosol Mini WRAS 1371 (Grimm Technologies Inc, Douglasville, GA, USA).
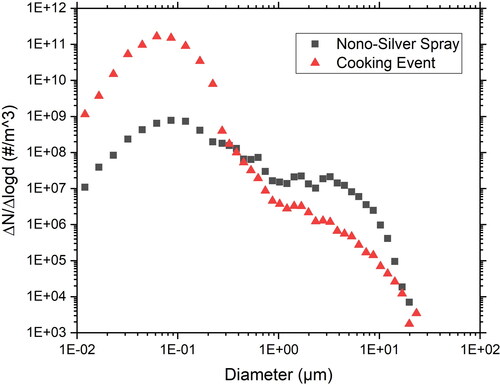
Figure 6. PM2.5 concentrations measured in the Control Exposure Facility after spraying a nanosilver product.
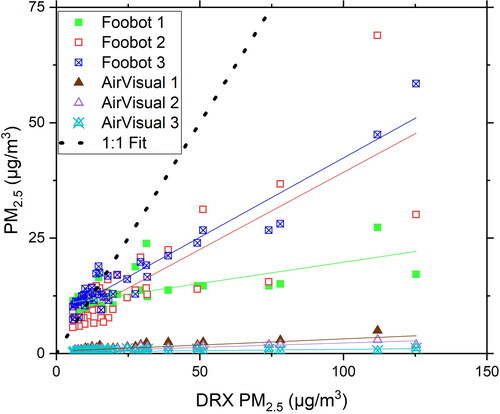
Figure 7. PM2.5 levels measured in the indoor environment during cooking.