
Figures & data
Figure 1. (a) Schematic diagram of the rTDMS. The main components of the rTDMS include an aerodynamic lens (ADL), a graphite collector and a copper holder, a CO2 laser, and a QMS. (b) Detailed geometry of the graphite collector and the QMS. A cross-beam type ionizer is located ∼50 mm from the graphite collector. The CO2 laser is irradiated through the ionizer cage. (c) Detailed geometry of the graphite collector.
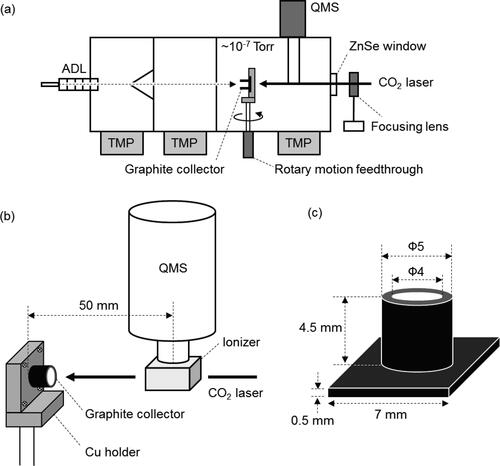
Table 1. Sensitivity at m/z 48 (pC ng−1 as sulfate) for internal and external mixtures of AS and SS particles.
Figure 2. Temporal profiles of (a) radiation temperatures of the graphite collector as a function of elapsed time since the laser on. The temperature data were obtained independently from the ion signal measurements, and the ensemble of lines represent repeated measurements on different days. (b)-(e) Temporal profiles of ion signals originating from single-component solid sulfate particles as a function of elapsed time since the laser on. It should be noted that the elapsed time may contain an error of ∼1 s because the laser operation was performed manually.
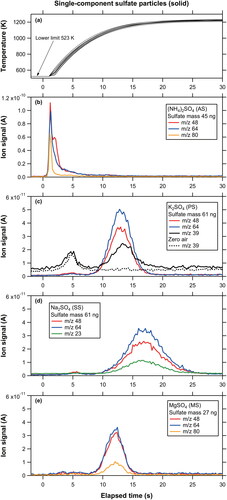
Figure 3. Scatterplots of integrated ion signals versus mass loadings (SO4 for m/z 48, 64, 80; K for m/z 39; Na for m/z 23) for (a) AS, (b) PS, (c) SS, and (d) MS particles. The slope, intercept, and r2 values for the linear regression are indicated in the legend. The systematic errors originating from the collection efficiencies are shown as the error bars for selected data points (see Section 4.3).
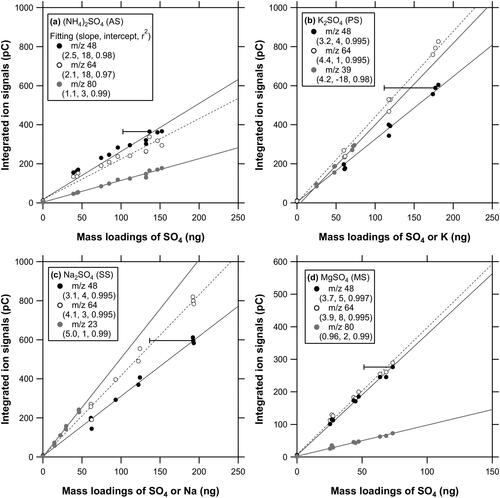
Figure 4. Scatterplots of m/z 48 to 64 ion signals for AS, PS, SS, and MS particles. The ratio of the transmission efficiency of m/z 48 to 64 ions in the quadrupole, as measured by using the mass spectra of noble gases, is incorporated in the ion signals for m/z 64. Fragment ion ratios reported in the literature are shown for comparison.
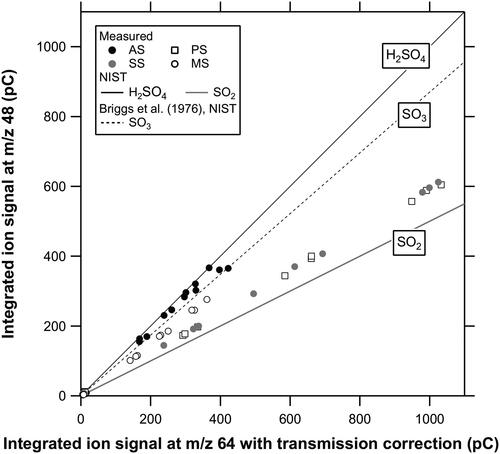
Figure 5. Temporal profiles of ion signals originating from (a) internal mixture of AS and SS, (b) external mixture of AS and SS (loading of AS followed by that of SS), and (c) external mixture of SS and AS (loading of SS followed by that of AS).
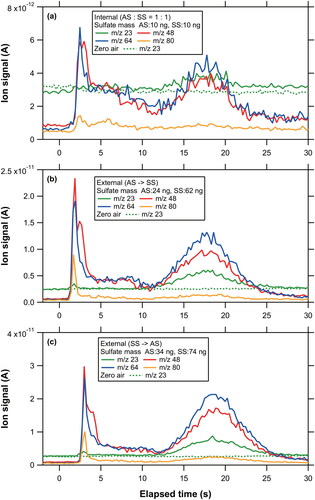
Figure 6. Temporal profiles of the major ion signals originating from multi-component sulfate particles: (a) AS:PS = 1:1, (b) AS:SS = 1:1, (c) AS:MS = 1:1, and (d) AS:PS:SS:MS = 1:1:1:1.
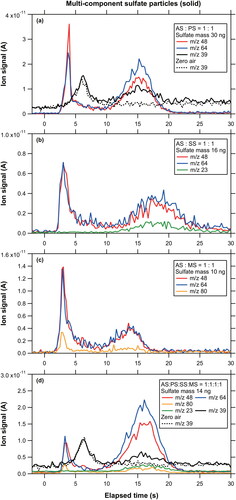
Figure 7. Comparison between measured and predicted m/z 48 ion signals originating from multi-component sulfate particles with various molar ratios. The solid and shaded lines represent the linear regression lines for (AS:PS:SS:SS) = (1:2:1:1) and (1:3:1:1), respectively. The red line represents the linear regression line for the other groups. The systematic errors originating from the collection efficiencies are shown as the error bars for a selected data point (see Section 4.4).
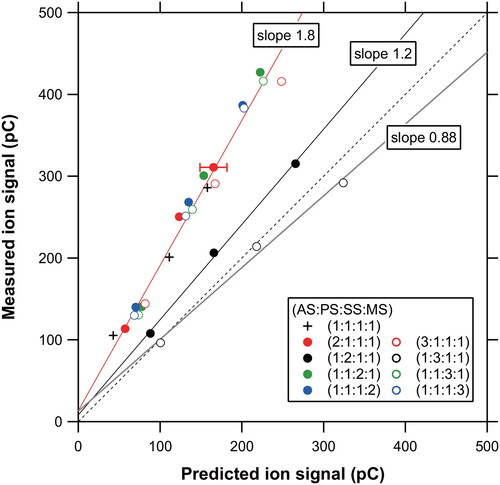
Figure 8. (a) Temporal profiles of ion signals at m/z 48 (SO+), 64 (SO2+), and 80 (SO3+) originating from ambient aerosol particles. (b) Time series of the mass concentration of sulfate measured at TMU and that of PM2.5 obtained from the nearest monitoring station on August 6, 2020. Note that the PM2.5 values are preliminary. The systematic errors originating from the collection efficiencies are shown as the error bar for a selected data point (see Section 4.3). The dashed line represents the LOD values for sulfate mass concentrations estimated from the m/z 48 signals ().
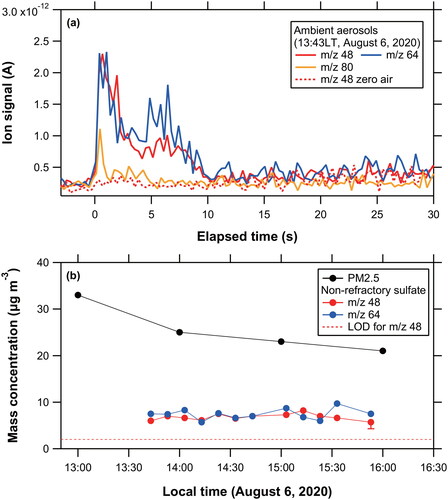
Figure 9. (a) Temporal profiles of ion signals at m/z 23 (Na+), 48 (SO+), and 64 (SO2+) originating from ambient aerosol particles and laboratory-generated SS particles obtained on 5 August 2020. We introduced ambient aerosol particles sequentially after introducing laboratory-generated SS particles. (b) Scatterplots of integrated ion signals versus mass loadings (SO4 for m/z 48 and 64; Na for m/z 23) for SS particles with and without the loading of ambient aerosols.
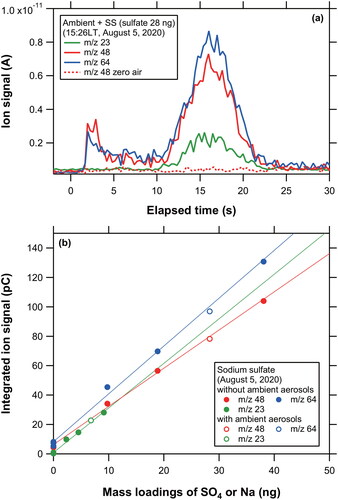
Table 2. Limit of detection (LOD) for mass concentration of sulfate (µg m−3) for AS, PS, SS, and MS particles with a total measurement cycle of 10 min (particle collection time of 6 min)a.