Figures & data
Figure 1. Electron micrographs (a, b) and SAED patterns (c, d) for particles collected at Okinawa, Japan (Ueda et al. Citation2011). Types 1, 2, and 3, respectively, show single-ball type, RR-shaped type, and clustered type. Panels (c) and (d), respectively, show typical SAED patterns for types 1 and 2 particles.
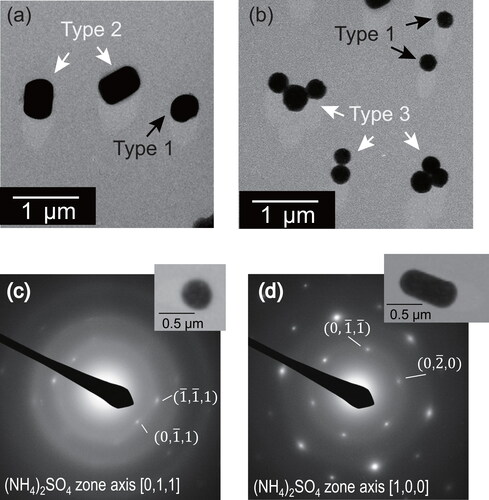
Figure 2. Schematic diagram of the experiment setup used to collect sample particles on the TEM grid.
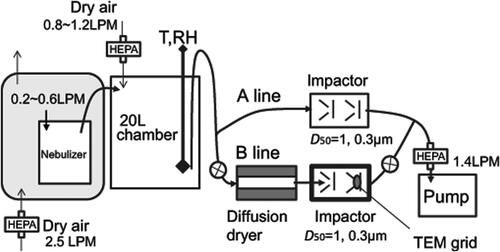
Table 1. Experimental conditions of TEM samples.
Figure 3. Electron micrographs of ammonium sulfate particles collected through a diffusion dryer. The 20 L chamber was controlled to have 95%RH (a) and 37%RH (b).
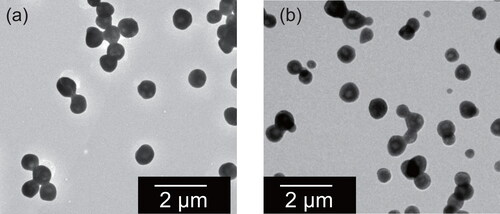
Figure 4. Electron micrographs of ammonium sulfate particles before (a) and after (a’) exposure to 75%RH for one day at atmospheric pressure for the same sample region. White arrows indicate particles that were found after exposure to have changed shape.
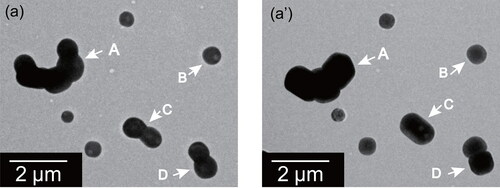
Figure 5. Electron micrographs of ammonium sulfate particles before (a–f) and after (a’–f’) exposure under metastable RH conditions at atmospheric pressure for the same sample region. Panels (a’), (b’), and (c’), respectively, show particles after exposure at 59%RH for 3 h, 1 day, and 3 days. Panels (d’), (e’), and (f’), respectively, portray particles after exposure at 75%RH for 3 h, 1 day, and 3 days. White arrows indicate examples of particles or components that change shape, as found after exposure.
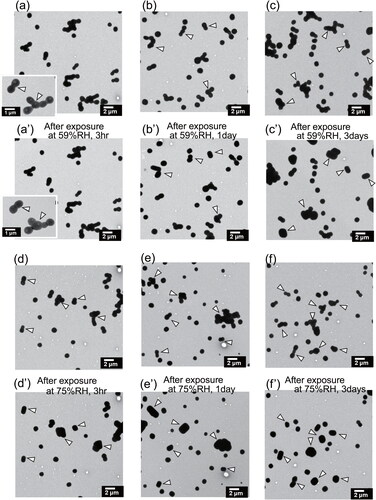
Figure 6. Relations between the exposure time under metastable RH conditions and the number fraction of shape-changed particles in ball-type particles and double-ball clusters.
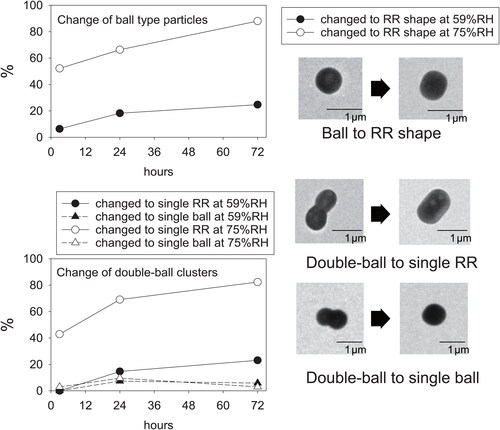
Figure 7. Shape parameters before and after exposure at 75%RH for one day for ball-type particles and double-ball clustered particles before exposure: (a) circle-equivalent diameters D, (b) circularity factor CF, and (c) ratio of maximum length to minimum length Rmax/min. Numbers in brackets in the legend are the numbers of analyzed particles.
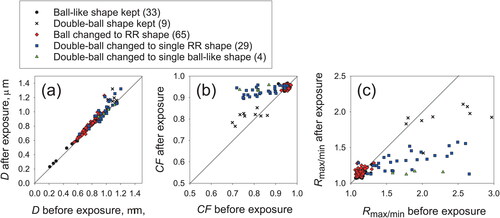
Figure 8. Electron micrographs of mixed particles of ammonium sulfate and oxalate at weight ratios of (a) 9:1 and (b) 3:2. Black arrows indicate thin parts having lath-like parts, regarded as oxalate.
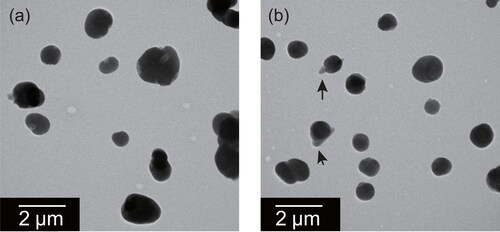
Figure 9. Electron micrographs of mixed particles of ammonium sulfate and oxalate at the weight ratio of (a) 9:1 and (b) 3:2 after exposure at 75%RH for one day. White arrows indicate parts having RR shape. Black arrows indicate thin parts, regarded as oxalate-rich.
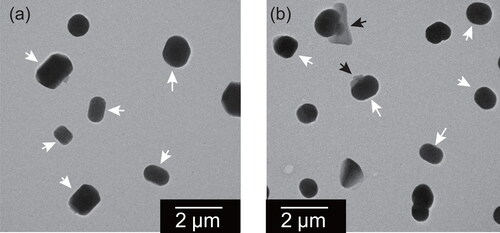
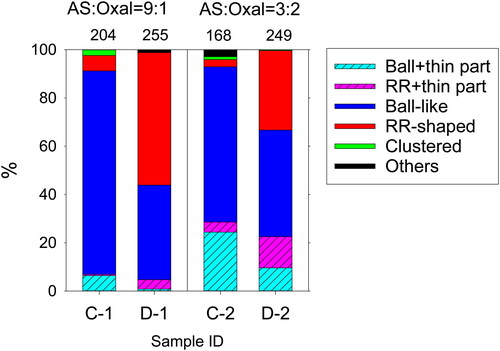
Figure 10. Number fractions of the respective morphological types for samples of mixed particles without exposure and after exposure. The fraction was estimated for particles smaller than 1 µm in circle-equivalent diameters. Numbers above the columns are numbers of analyzed particles.