Figures & data
Figure 1. Depiction of the sampler characterization system. Relative humidity-conditioned air (a) was directed around the nozzle, which was supplied with dry compressed air (b) and liquid (c). A HEPA-filtered passive inlet (d) allowed for dissipation of any pressure buildup due to slight differences in the supply and exhaust airflows. The generated aerosol (e, in cut-away view) was carried through a 10.2 cm diameter stainless steel duct (f) before being directed by a 3.8 cm diameter 90-degree bend into the sampling chamber. Perforated stainless steel plates (g) at the top and bottom of the chamber facilitated even distribution of the air stream throughout the chamber volume. The aerosol was sampled at ports located around the circumference of the chamber (h, and H inset). Aerosol samplers were positioned as follows: (1) Gelatin filter, (2) AGI, (3) Midget impinger, (4) BC251, (5) Biosampler, and (6) APS with 1:20 diluter (H inset). A Vaisala HM40 probe (i) measured the temperature and relative humidity of the air stream before it was exhausted from the chamber through a HEPA filter (j).
Figure 2. EBOV/Mak and PSL-microsphere aerosol concentrations. Data from low relative humidity tests are shown in white, and data from high relative humidity tests are shown in gray. MI = midget impinger, BC251 = total collected across all stages of the NIOSH BC251, AGI = Model 7541 All Glass Impinger, BS = Biosampler, GF = 25 mm gelatin filter. Sampler flow rates, in L/min, are shown in parentheses below each sampler type. Data are presented as the mean ± standard deviation of 6-7 replicate tests. (a) Samples were collected using gelatin filters set to flow at rates matching those of the other samplers to normalize for physical collection efficiecy at each port and allow evaluation of the uniformity of aerosol within the chamber. Two separate ports had filters flowing at 1.0 L/min, as both the midget impinger and the gelatin filter were operated at that flow rate during subsequent sampler comparison tests. Aerosol concentrations of 100-nm PSL microspheres (b) and EBOV/Mak (c) measured with the various samplers were significantly affected by sampler type and the interaction between RH and sampler. However, RH as an independent factor was only significant for EBOV/Mak concentrations.
Figure 3. Sampler Efficiencies. Data from tests at low relative humidity are shown in white, and data from tests at high relative humidity are shown in gray. MI = midget impinger, BC251 = total collected across all stages of the NIOSH BC251, AGI = Model 7541 All Glass Impinger, BS = Biosampler, GF = 25 mm gelatin filter. Data are presented as the mean ± standard deviation of 6-7 replicate tests. Relative physical efficiency values measured for all samplers are shown in (a), relative biological efficiency values are shown in (b), and total efficiency values are shown in (c).
Figure 4. EBOV/Mak in samples from gelatin filters with varied airflow rates. Data from low and high RH tests are shown in white and gray, respectively. The virus titers for each sample set are shown in (a), and the airflow normalized aerosol concentrations are shown in (b). Data are presented as the mean ± standard deviation of 4 replicate tests.
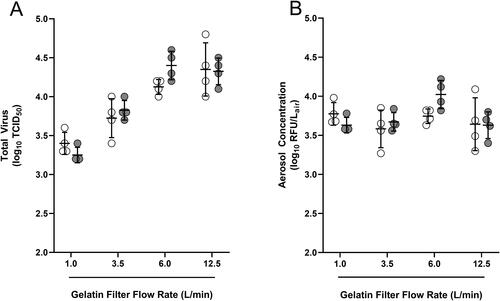
Figure 5. EBOV/Mak aerosol concentrations determined by two sampling and assay pathways. EBOV/Mak was aerosolized from virus stock dilutions ranging from 10−2.5 to 10−5. Viral concentrations are presented in infectious unit equivalents to facilitate comparison between different assays. (A) Aerosol concentrations of EBOV/Mak determined with gelatin filters flowing at 6-8 L/min, recovered in 2.5 mL FB DMEM, and assayed by microtitration on Vero-Ebola-reporter cells. The dotted line indicates the LOQ, calculated using one positive well in the undiluted assay row. (B) Aerosol concentrations of EBOV/Mak determined using Model 7541 AGIs and a plaque assay. The dotted line designated “High LOQ” was determined using ten plaques per well in the undiluted assay wells, and the dotted line designated “Low LOQ” was determined using one plaque per three wells in the undiluted assay wells. Overall, the gelatin filter/microtitration combination was more sensitive and had a wider range over which it had a linear relationship with the titers of the diluted stock material than the AGI/plaque assay combination.