Figures & data
Table 1. Technical properties of the air purifiers (Philips 2887/10) operated at a range of volume flows.
Figure 1. Sketch of the classroom indicating the position of the air purifiers (#1 to 4) and the measurement instrumentation at two locations A and B.
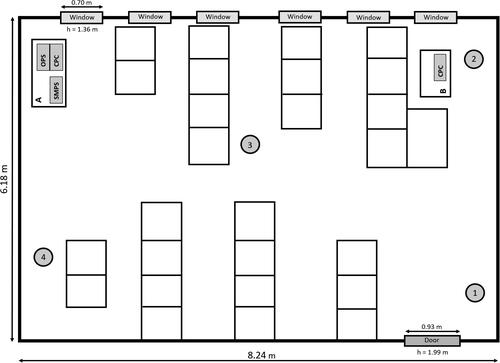
Figure 2. Top panel: Representative measurement of the total aerosol number concentration in the classroom with air purifiers (red and black line) and in the room without purifiers (blue line) during a lesson. Four air purifiers were operated at stage 3 during a lesson with windows and doors closed. A window was briefly opened in the room without purifiers at 12:06 for ∼1 min, when additional particles flowed in from outside. Particle concentrations are averaged over 1 min intervals. Middle panel: Number concentration of larger particles (0.3 to 10 µm, OPS measurement) in the classrooms with (red) and without (blue) air purifiers. Bottom panel: The particle mass concentration PM10 in the rooms with and without air purifiers. Values are more scattered due to low counting statistics for the largest particles that contribute most to the derived mass concentration.
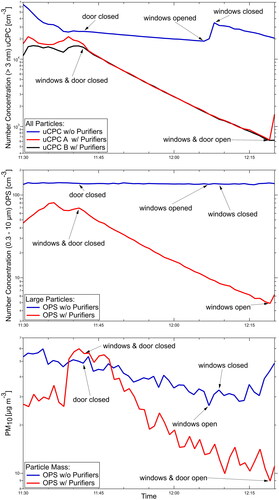
Figure 3. Reduction in aerosol particle concentration in a closed classroom without air purifiers (blue line) and with 3 or 4 air purifiers operating at stage 3 (3 × 257 m3/h per purifier, green lines; 4 × 257 m3/h per purifier, black lines) or stage ‘turbo’ (4 × 365 m3/h, red line). Data are normalized to a starting value of 10,000 particles cm−3. Data are displayed for the time intervals until door or windows were opened again.
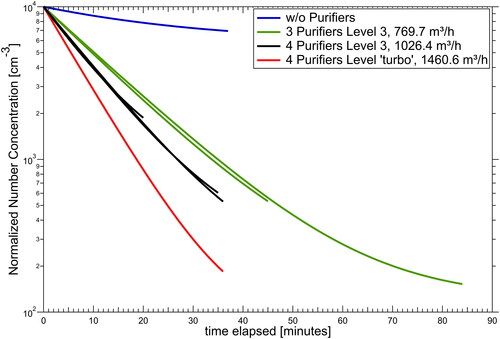
Figure 4. Measurement of the particle size distribution in the size range 10-300 nm as a function of time in the room with air purifiers (same lesson as in ). Red and yellow colors indicate high concentrations while green and blue colors indicate low concentrations. Particles <300 nm are filtered effectively and homogeneously.
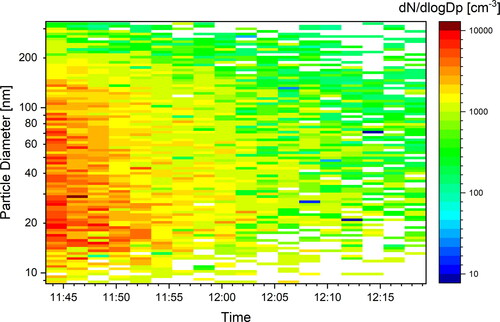
Figure 5. Total (black line) and size resolved decrease of particle concentrations for seven aerosol size bins of the OPS in the size range 0.3 to 5 µm (same lesson as in ). The mean particle diameter (dashed pink line) remains constant, indicating that all sizes decrease at the same rate.
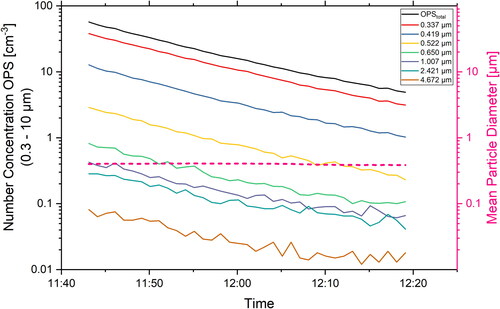
Figure 6. Estimated concentration of aerosol particles containing virus-RNA in a closed classroom (180 m3), in which we assume that a highly infective person emits on average 0.6 particles cm−3 of exhaled breath through loud speaking 50% of time and 0.06 cm−3 by breathing (red line without purifiers, blue line with purifiers) with an air exchange rate of 5.7 h−1. The dashed lines show estimates of the inhaled dose of virus-RNA units that is taken up by a person in the same room for 2 h.
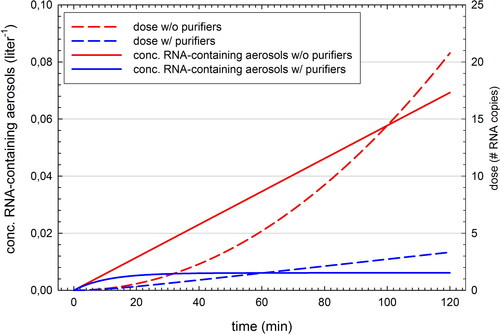
Figure 7. Left panels: Measurement of particle increase in a closed room without people, with and without purifiers. An atomizer is operated as a continuous particle source of NaCl solution droplets. 3 uCPCs and 2 OPS instruments measured at different positions in the room. Assuming an emission rate of 1.8 million particles s−1 a good agreement is reached between the model calculations and the measurements. Right panel: Sketch of the position of the aerosol generator (red), the three uCPC and OPS instruments (blue) and the position of the air purifiers (green) in the seminar room.
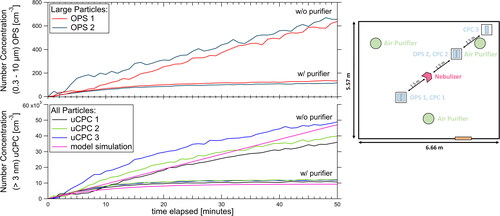
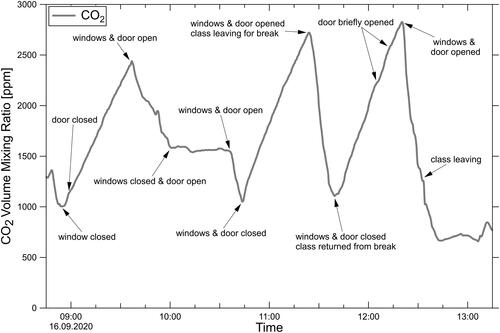
Figure 8. CO2 mixing ratio as measured in class during a school day. Even after venting the room for several minutes with door and windows wide open, CO2 levels do not drop below 1000 ppm. With classes proceeding in the closed room, CO2 levels quickly rise to mixing ratios of 2500 to 2800 ppm at the end of the lesson.