
Figures & data
Figure 1. Schematic diagram of the experimental setup for comparisons between the Aethalometer and the CPC. Aerosols were generated through liquid atomization before entering the DMA to select the mobility diameter (in this case 300 nm). Mass distributions were measured to determine particle mass with a removable APM in line. The CPC measured aerosol Np, while the filter-based Aethalometer measured BC mass concentration.
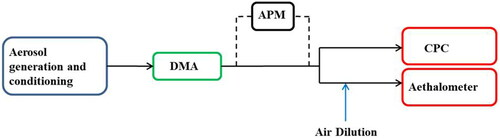
Figure 2. (a) Correlation of CPC mass concentration with eBC (BC equivalent mass concentration: μg m−3) at three different instrumental wavelengths: 370, 660 and 880 nm. Observations are for low mass concentrations (< ≈2.5 μg m−3) for particles with a mobility diameter of 300 nm. (b) Correlation at low mass concentrations with corrected SG values. Intercepts of best-fit lines were forced to zero. Less than a 1% impact was observed on the slope.
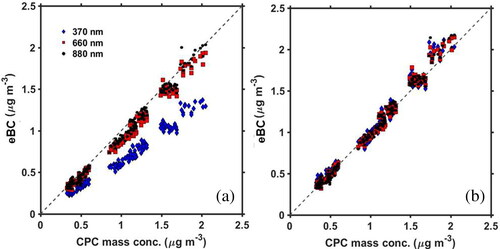
Table 1. Calculated SG values (and standard deviations) for three separate runs with 300 nm Cab-O-Jet particles for mass concentration up to ≈2.5 μg m−3. Also shown is the percent deviation from the manufacturer’s constant values for SG at multiple wavelengths.
Figure 3. Results for eBC up to ≈20 μg m−3. (a) Correlation of CPC-determined mass concentration with uncorrected filter-based eBC. (b) Correlation of CPC mass concentration eBC up to 20 μg m−3 with only the loading correction (described in the SI) applied. (c) Correlation of CPC mass concentration with eBC with both the loading correction and corrected SG applied.
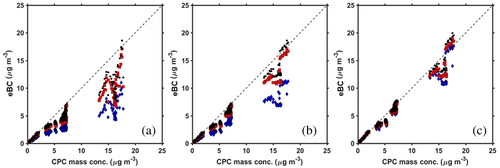
Table 2. Best fit slope (where the y-intercept is forced through zero) values for BC up to 2.5 μg m−3 for the raw data and the data corrected for the newly determined SG values.
Figure 4. Response of Aethalometer at 370 nm (blue diamonds), 660 nm (red squares) and 880 nm (black circles) to the CPC-derived BC using a 14% BC mass fraction solution with BrC. The coating causes a positive interference that increases at shorter wavelengths.
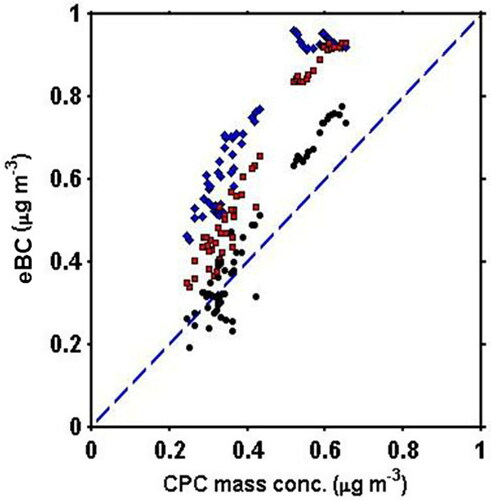
Table 3. Best-fit slope (where the y-intercept is forced through zero) values up to 20 μg m3 for the raw data and the data corrected for the loading effect and newly determined SG values.
Table 4. Values of the slope and 1σ when the y-intercept is forced through zero for the multiple mass fractions of BC with AS. Best fit correction factors are the inverse of these slope values.
Table 5. Response of the Aethalometer to pure BrC surrogate. The second column is the slope of Aethalometer signal vs. BrC mass concentration with the y-intercept forced through zero. Response of BrC decreases as the detection wavelength increases.