
Figures & data
Figure 1. Microfluidic electrochemical sensor for online monitoring of ambient OP. (A) Schematic overview of the online monitoring system of OP with a microfluidic electrochemical method. Adapted with permission from Sameenoi et al. (Citation2012). Copyright (2012) American Chemical Society. (B) Correlation between DTT consumption and PM mass. (a) Results from the online monitoring system. (b) Results from traditional DTT assay. From Koehler et al. (Citation2014), copyright ©2014 American Association for Aerosol Research, reprinted by permission of Taylor & Francis Ltd, http://www.tandfonline.com. on behalf of American Association for Aerosol Research.
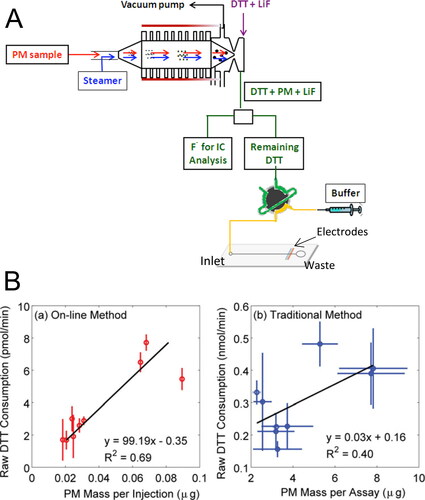
Figure 2. Microfluidic paper-based analytical devices (µPAD) for ambient OP. (A) Steps to perform DTT assay in µPAD. Reprinted with permission from Sameenoi et al. (Citation2013). Copyright (2013) American Chemical Society. (B) Schematic diagram to perform GSH assay in µPAD. (a) A color intensity-based method. (b) A distance-based method. Reproduced from Dungchai et al. (Citation2013) with permission from The Royal Society of Chemistry.
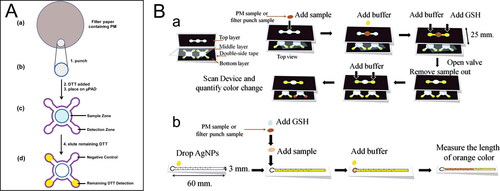
Figure 3. A representative microfluidic system for high-throughput on-chip immunoassay performance. The microfluidic system consists of twelve uniform structures and an immunodetection chip. The single structure unit consists of a concentration gradient generator and cell culture chambers. Reprinted with the permission from Zheng et al. (Citation2017). Copyright (2017) American Chemical Society.
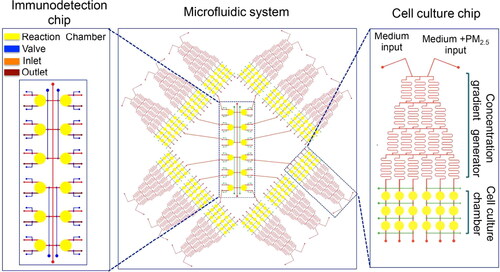
Figure 4. Selected microfluidic techniques for analysis of single‐cell response (A) A microfluidic cell trap array that is applied to measure single‐cell ROS response from PM exposure. (a) Design of the microfluidic cell trap array. Adapted from He et al. (Citation2019). Copyright (2019) The American Association of Immunologist, Inc. (b) Representative heatmaps of single‐cell traces of ROS response induced by two different PM extracts. Adapted from Liu, Whitley et al. (Citation2020). Copyright (2020) American Chemical Society. (B) Schematic diagram of the microfluidic cell trap array for real‐time monitoring of nanoparticles uptake. (a) A sequential injection of cells and nanoparticles into the microfluidic cell trap array. (b, c, d) Temporal aspects of the protocol: cell trapping, nanoparticles delivery, and antigen processing. Reproduced from Cunha-Matos et al. (Citation2016) with permission from The Royal Society of Chemistry.
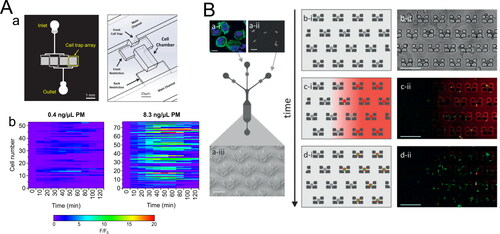
Figure 5. Representatives of microfluidic techniques for 3D cell culture and lung‐on‐a‐chip model. (A): (a) Diagram of coculture cell lines. (b) Overview of the microfluidic 3D coculture device. (c) ROS production upon exposure to benzo[a]pyrene and nicotine based on microfluidic coculture, microfluidic monoculture, and off-chip monoculture methods. Adapted with permission from Zhang et al. (Citation2020), Copyright (2020) American Chemical Society. (B) Schematic diagram of the lung‐on‐a‐chip model for PM exposure. Reprinted with permission from Xu et al. (Citation2020). Copyright (2020) American Chemical Society.
![Figure 5. Representatives of microfluidic techniques for 3D cell culture and lung‐on‐a‐chip model. (A): (a) Diagram of coculture cell lines. (b) Overview of the microfluidic 3D coculture device. (c) ROS production upon exposure to benzo[a]pyrene and nicotine based on microfluidic coculture, microfluidic monoculture, and off-chip monoculture methods. Adapted with permission from Zhang et al. (Citation2020), Copyright (2020) American Chemical Society. (B) Schematic diagram of the lung‐on‐a‐chip model for PM exposure. Reprinted with permission from Xu et al. (Citation2020). Copyright (2020) American Chemical Society.](/cms/asset/fc7c0353-0c8e-42da-8737-7313bea1165e/uast_a_1879373_f0005_c.jpg)
Figure 6. An organ‐level lung microfluidic platform that allows for exposing PM to cells at an air‐liquid interface. (A) Overview of the entire system for aerosolized PM generation, PM exposure, and the microfluidic platform. (B) Schematic diagram of the microfluidic platform. Reprinted with permission from Zheng et al. (Citation2019). Copyright (2019) American Chemical Society.
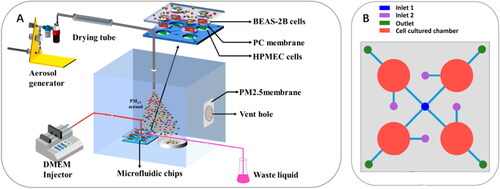
Table 1. A summary of microfluidic techniques and their applications and advantages in PM toxicity studies.