Figures & data
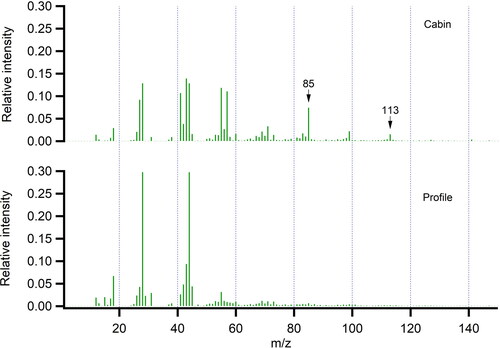
Figure 1. Schematic representation of CPC comparison experiments.
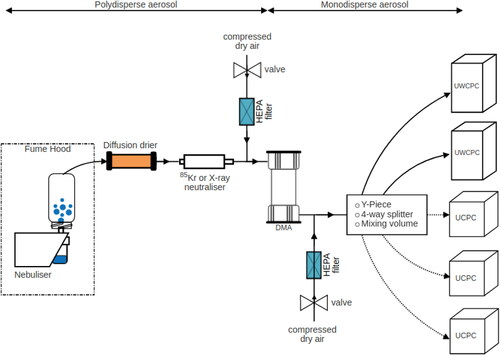
Figure 2. Example of a single diameter ammonium sulfate aerosol sampled by the two candidate CPCs at five different concentrations spanning three orders of magnitude.
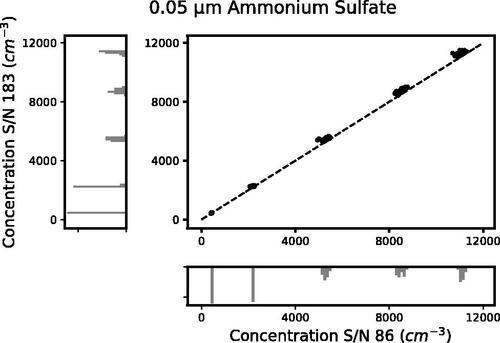
Table 1. Summary of all flights and data coverage from cabin sampling.
Figure 3. Time series of particle number concentration inboard and outboard and altitude from flight B989. Also shown are the take-off and landing times. X-axis is limited to 6 × 104 cm−3, not the full scale of the 3786 CPC range.
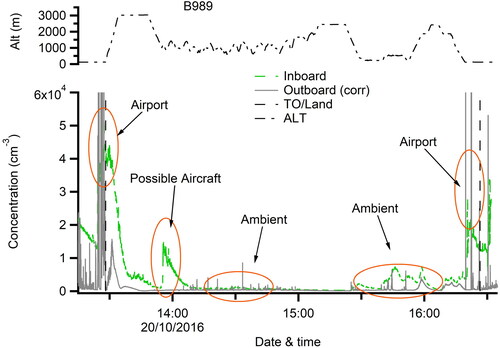
Figure 4. Time series of particle number concentration inboard and outboard and altitude from transit flight P153, with minimal science activity on board. Also shown are the take-off and landing times.
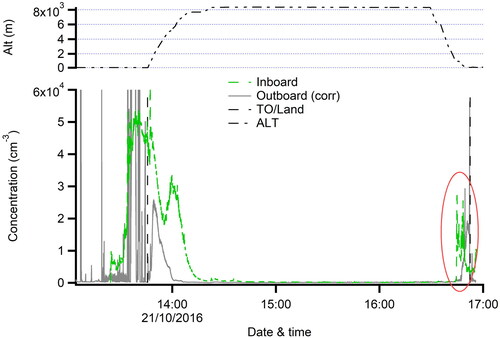
Figure 5. Organic mass spectra from flight C003 during take-off (top) and landing when both CPCs were high (bottom).
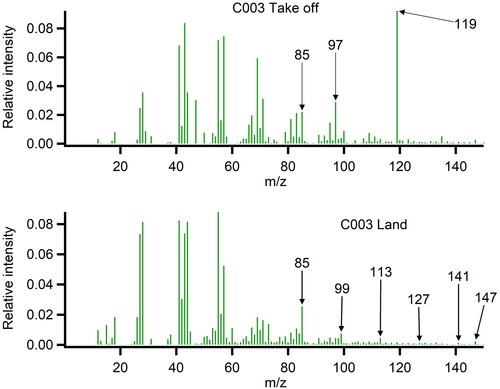
Figure 6. Time series of particle number concentration inboard and outboard, altitude, and AMS organic mass concentration from flight C008 showing a fume event. The insert is an expanded section of the flight on approach/landing. Vertical dashed lines denote take-off/landing.
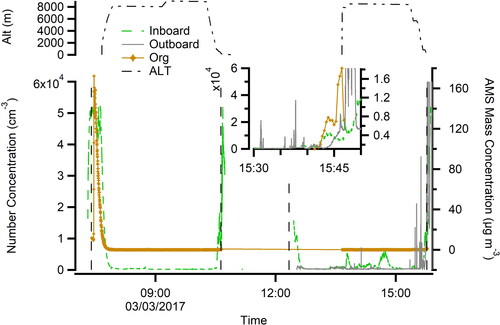
Figure 7. Mass spectra from in cabin and external air during flight C040. Note that the AMS was switched from cabin to ambient and back to cabin during a profile in the middle of the flight.