
Figures & data
Figure 1. (a) An illustration of the sampling position of the performer, the sampling funnel and the aerosol instrumentation. (b) Continuous time series of data recorded from one participant completing 12 activities (5 repetitions of each). The zero-background is clearly apparent between measurements.
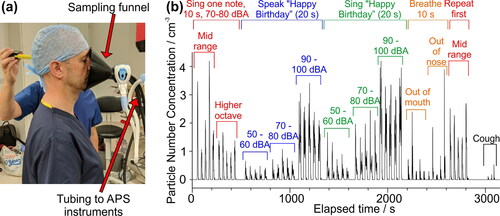
Figure 2. (a) Box and whisker plot showing particle number concentration and (b) mass concentrations for the same series of activities for all 25 participants. See Methods section (“Data and Statistical Analysis”) for full description of analysis and reported values.
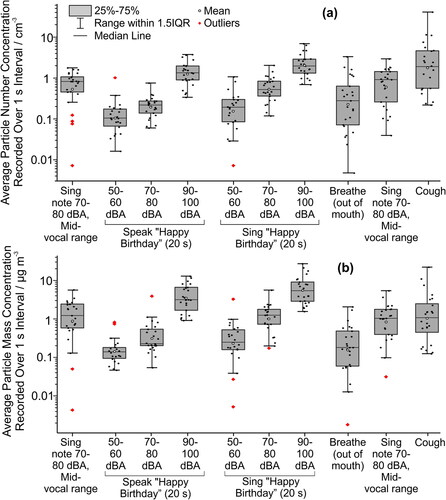
Table 1. The measured aerosol concentrations from different expiratory activities. Number concentration data correspond to the series of expiratory activities plotted in (in cm-3), and mass concentration correspond to the series of expiratory activities plotted in (in μg·m-3). Provided are the statistical parameters visualized by the box and whisker plots. Note that these parameters were calculated on the logarithmically transformed data (see Materials and Methods). The number of participants for each activity is given by n.
Figure 3. Comparison of average aerosol number concentrations (linear scale) from speaking and singing at 90-100 dBA by the full cohort, males (12), females (13), opera (5), musical theater (6), choral (5) and other genres (9).
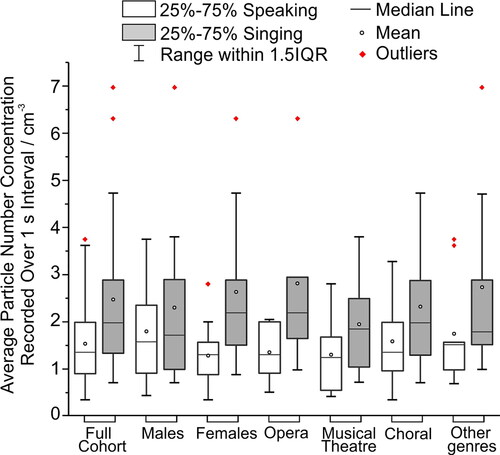
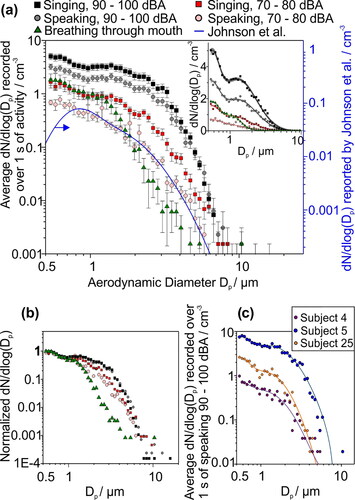
Figure 4. (a) Comparison of the size distributions from singing (squares) and speaking (circles) at different levels of loudness (70-80 dBA red; 90-100 dBA gray/black) with breathing (green triangles). The size distribution reported for speaking by Johnson et al. (Citation2011) is shown by the blue line (right scale), data that should be most similar to the light red circles. The relative variations in concentrations represented by the two scales are equal. Error bars report standard error of the mean. The inset figure compares the fitted size distributions with the experimental data with a linear scale, as reported in Table S2 (SI). Shaded area about the fit line represents the 95% confidence bound of the fit. (b) Comparison of the size distributions in (a) normalized with respect to the highest measured value of dN/d log(Dp) for each dataset. (c) Size distributions of the aerosol measured from three individual participants when speaking 90–100 dBA, i.e., data contributing to the mean size distributions represented by gray circles in (a).
Supplemental Material
Download PDF (1.3 MB)Data availability
Correspondence and requests for materials should be addressed to JPR.