Figures & data
Figure 1. Schematic of the CODG. The flask (insert a) is modified from a 100 mL pyrex Erlenmeyer flask. The schematic shows the location of each major piece of equipment (not to scale) on the benchtop, excluding clamp stands and frames. Black lines represent black conductive tubing, and hollow lines represent stainless steel tubing. This assembly is designed to fit on any standard laboratory bench. Details of the dilution drum and manufacturer information are in the text.
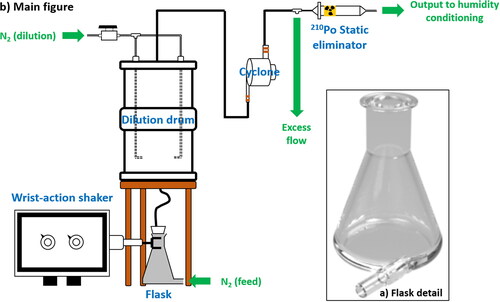
Figure 2. The mean ATD aerosol size distributions are shown for different mechanical energy sources: (a) sonicator, (b) vortex shaker, (c) orbital shaker at low speed, (d) orbital shaker at high speed, and (e) wrist-action shaker. Red markers indicate SMPS data, whereas blue markers indicate APS data. Error bars represent ± 1σ. Mobility diameter (Dm) and aerodynamic diameter (Da) were converted to volume-equivalent diameter (DVE) using the calculations and parameters found in the online supplementary information of Mitroo et al. (Citation2019). The symbol nA refers to the aerosol surface area distribution. The selected distributions represent the best available data for each mechanical energy source. Note that for (a), the flow through the cyclone was set for a PM2.5 cutoff, whereas the rest of the data in this figure is for a PM1 cutoff. Considering the poor performance in (a), we did not replicate the experiment at PM1 cutoff and discarded the choice of a sonicator. Vertical lines are included to show the respective cutoffs using a short-dashed line (PM1) and long-dashed line (PM2.5).
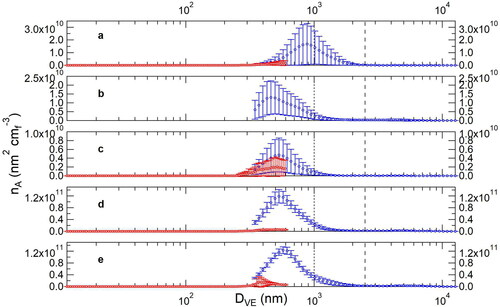
Figure 3. Comparison of dust emission, reported as total surface area concentration, at the same wrist-action shaker setting (i.e., mechanical energy input) at 30% RH conditioning. Great Salt Lake and Owens Lake (cold colors) represent solid crusts, whereas Sulphur Springs Draw and Lordsburg (warm colors) represent loose sediment. “High dilution” refers to N2 (dilution)/N2 (feed) ≫1, whereas “low dilution” refers to N2 (dilution)/N2 (feed) ∼1. Please refer to for details.
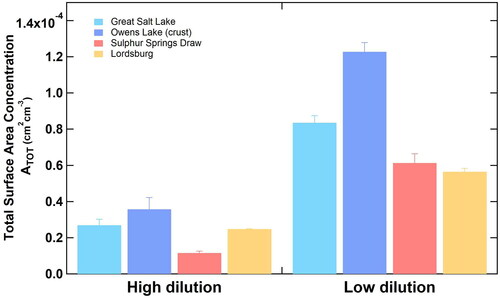
Figure 4. Bulk soluble inorganic ion composition for sediment and aerosols > PM1 (collected in cyclone bycatch) for six samples, showing the mass fraction contributions to the total mass. Unmeasured, primarily insoluble, chemical components corresponded to 40–90% of the total sample masses.
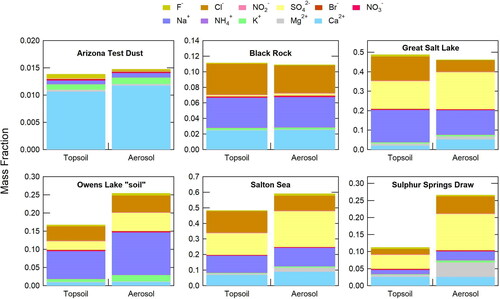
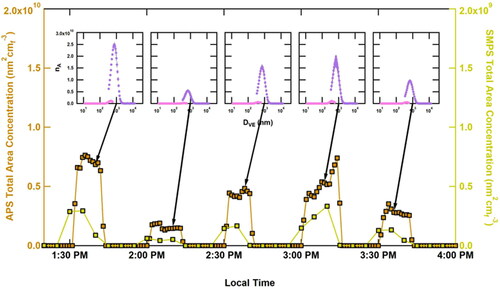
Figure 5. Timeseries showing the stability of the total dust aerosol surface area in our system. The symbol nA, labeling the y-axes of the inserts, refers to the aerosol surface area distribution. The insets represent the mean ±1σ of the size distribution during the last 10 min of each 15-min dust generation period.