Figures & data
Table 1. Phages, viruses features and qPCR data for genome recovery.
Figure 1. Experimental setup for aerosolization of bacteriophages and influenza in an aerosol chamber. The diagram is not to scale: (A) collection chamber, (B) atomizer, (C) desiccator, (D) Spot sampler™, (E) closed-face-cassette, (F) temperature/relative humidity probe, (G) Aerosol Particle Sizer, (1) air input (generation flowrate set 3 L/min in the collection chamber), and (2) air output.
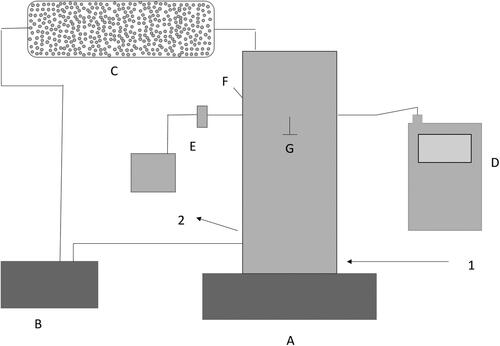
Table 2. Environmental conditions and characteristics of bioaerosols (APS measurements) for each set of experiments.
Figure 2. Ratio of relative culturability (Spot Sampler™/CFC) for all phages after 60 min and 4 h of sampling (n = 5 for each phage). A ratio greater than one indicates that the liquid Spot Sampler™ was more efficient at preserving the infectivity of phages. The value above each boxplot represents the p-value of the paired ratio t-test. A p-value below 0.05 means that the relative recovery between the Spot Sampler and CFC samples was statistically significantly different. There is one p-value for each sampling time. In the box plot, the whiskers represent the 5th and the 95th percentiles; the red line symbolizes a ratio of one, i.e., an eguality of relative culturability between the two samplers.
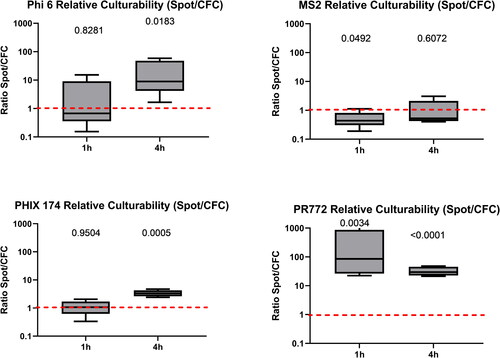
Figure 3. Ratio of relative genome recovery (Spot Sampler™/CFC) for all phages after 60 min and 4 h of sampling (n = 5 for each phage). A ratio greater than one indicates that the liquid Spot Sampler™ was more efficient at recovering phage genomes. The value above each boxplot represents the p-value of the paired ratio t-test. A p-value below 0.05 means that the difference in relative recovery between Spot Sampler and CFC was statistically different. There is one p-value for each sampling time. In the box plot, the whiskers represent the 5th and the 95th percentiles; the red line symbolizes a ratio of one, i.e., an equality of genome recovery efficiency between the two samplers.
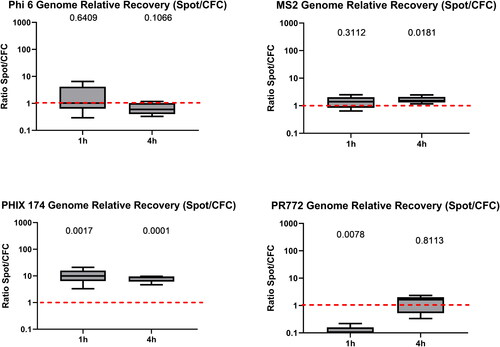
Figure 4. Ratio of total recovery of genomes for four bacteriophages using the dry Spot Sampler™ and CFCs (n = 25 for each phage). The red line symbolizes a ratio of one, i.e., an equality of genome recovery efficiency between the two samplers.
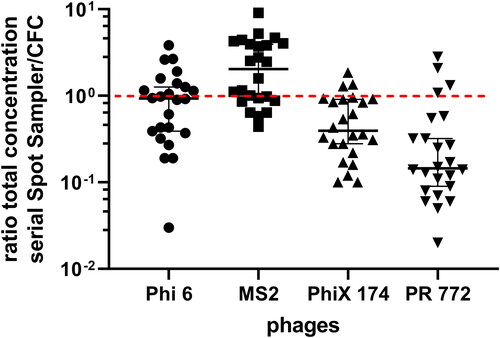
Figure 5. Overtime monitoring of normalized recovery in both samplers for DNA bacteriophages.
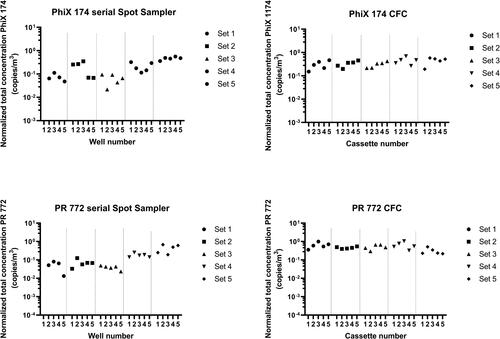
Figure 6. Overtime monitoring of normalized recovery in both samplers for RNA bacteriophages.
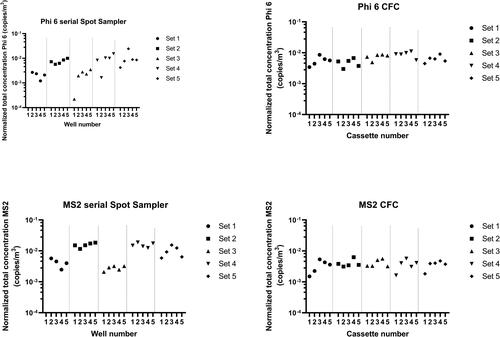
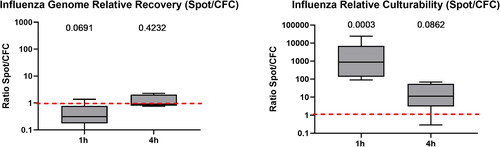
Figure 7. Ratio of relative genome recovery and relative culturability (Spot Sampler™/CFC) for influenza after 60 min (n = 6) and 4 h (n = 5) of sampling. A ratio greater than one indicates that the liquid Spot Sampler™ was more efficient at preserving the genome and culturability of influenza. The value above each boxplot represents the p-value of the paired ratio t-test. A p-value below 0.05 means that the difference in relative recovery between the Spot Sampler™ and CFCs was statistically different. There is one p-value for each sampling time. In the box plot, the whiskers represent the 5th and the 95th percentiles; the red line symbolizes a ratio of one, i.e., an equality of genome recovery efficiency and of relative cuturability between the two samplers.