Figures & data
Figure 1. Ten mask materials and a face shield. All materials have a single layer except the thin cotton, which has two layers. SEM images are shown at two scales: the white scale bar represents 1 mm and the yellow one represents 200 μm. There are no SEM images for the face shield, which was made of a plastic sheet.
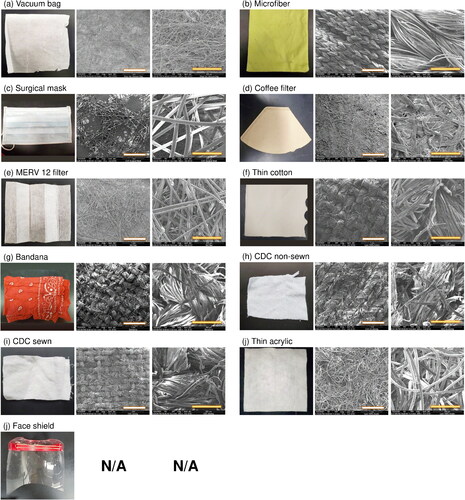
Figure 2. Schematic of experimental setup for determining (a) inward protection efficiency and (b) outward protection efficiency.
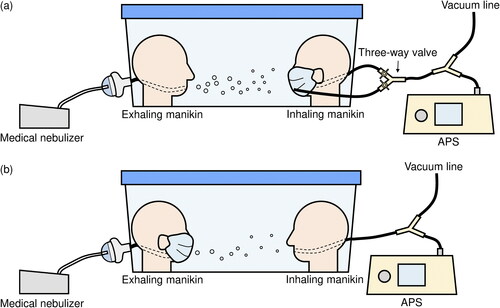
Figure 3. Concentration and size distribution of particles as a function of aerodynamic diameter generated by (a) collison nebulizer, (b) FMAG, (c) medical nebulizer, without a filter (blue dashed line) or downstream of a MERV 12 filter (red solid line), and (d) air brush. In panel (d), the diameter was corrected from the measured size of the droplet stains on the slide by a factor of 1.5. Shading and error bars represent the standard deviations of triplicates.
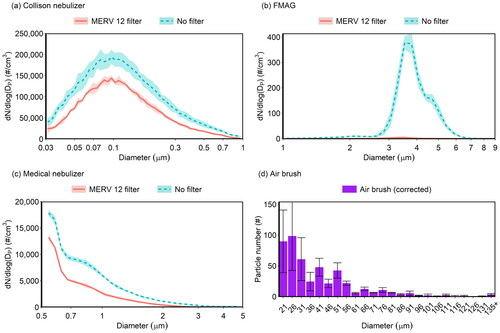
Figure 4. Material filtration efficiency of 10 mask materials as a function of aerodynamic diameter. The bandana appears twice because it was tested in both 1-ply and 2-ply configurations. Shading represents the standard deviations of triplicates.
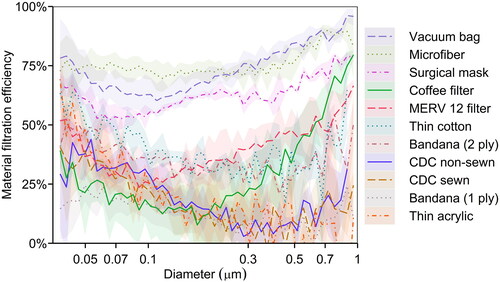
Figure 5. Inward and outward protection efficiency of 10 masks and a face shield. These efficiencies are defined for close-range, face-to-face interactions. The face shield was not tested for material filtration efficiency because it did not allow air flow through the material. Error bars represent the standard deviations of triplicates.
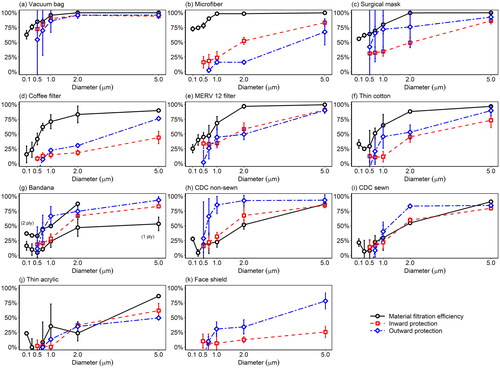
Figure 6. Pressure drop and filter quality factor at 0.3 μm of 10 mask materials, sorted on the basis of material filtration efficiency (). The bandana appears twice because it was tested in both 1-ply and 2-ply configurations. Error bars represent standard deviations of triplicates. In panel (a), there are no error bars for the last two materials as the measurements fell below the detection limit of the pressure gauge.
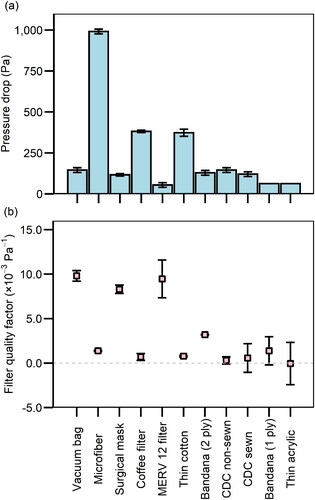
Figure 7. Inward and outward protection efficiency for all masks. For improved readability, error bars are not shown here, but they appear in .
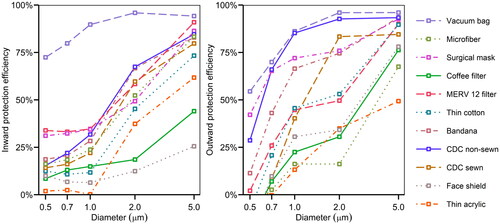
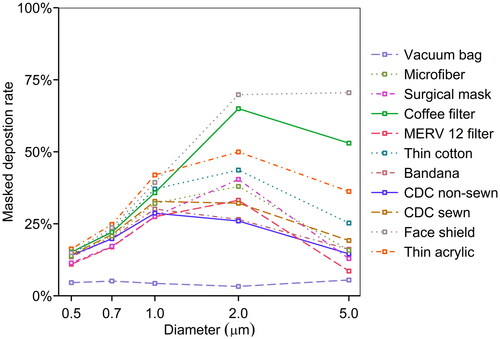
Figure 8. Masked deposition rate of 10 masks and a face shield as a function of the aerodynamic diameter.