Figures & data
Figure 1. Locations of passive PM samplers and November 2018 Camp Fire. Map was generated using ArcGIS Online (ESRI, Redlands, USA) and wildfire perimeter data (CAL FIRE Citation2019). Also shown is a typical HYSPLIT, 12 h wind trajectory during the smoke episode, generated for 8 November, 2018 (NOAA, 2020).
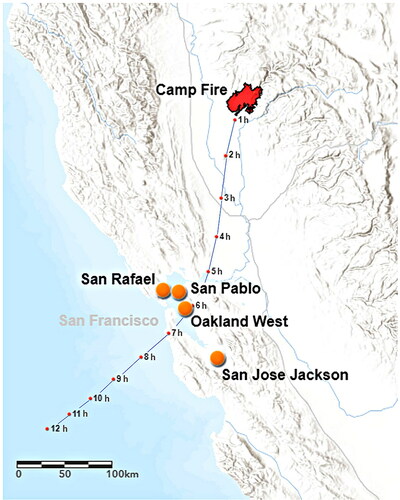
Figure 2. PM mass concentration size distributions measured during wildfire periods (solid lines) and non-wildfire periods (dashed lines) using passive PM samplers and 5 kV analyses, showing enhanced sub-micrometer mode during wildfires. PM mass per volume air is normalized by the dimensionless width of each size bin (dC/dlogda [µg/m3]) and plotted as a function of midpoint aerodynamic diameter (da, m).
![Figure 2. PM mass concentration size distributions measured during wildfire periods (solid lines) and non-wildfire periods (dashed lines) using passive PM samplers and 5 kV analyses, showing enhanced sub-micrometer mode during wildfires. PM mass per volume air is normalized by the dimensionless width of each size bin (dC/dlogda [µg/m3]) and plotted as a function of midpoint aerodynamic diameter (da, m).](/cms/asset/08efc11f-c42f-45c3-a44b-d80b2d8e07c4/uast_a_1895429_f0002_c.jpg)
Table 1. Relative accumulation rates of metals on residential MERV11 furnace filters.
Figure 3. Indoor/outdoor PM mass concentrations from San Rafael passive PM samplers. (a) Mass concentration size distributions as a function of midpoint aerodynamic diameter of each size bin. (b) Indoor-outdoor penetration ratio of size distributions in (a).
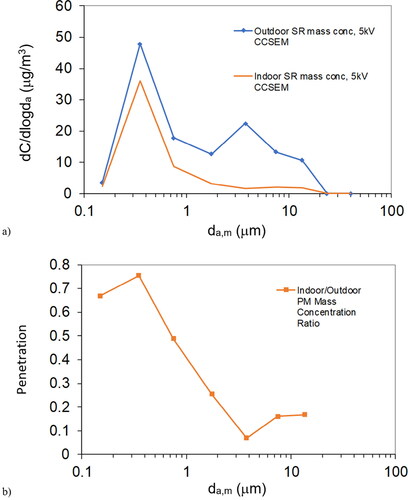
Figure 4. Typical micro-images of particles detected automatically by 5 kV CCSEM in San Rafael wildfire samples collected (a) outdoors and (b) indoors, both clearly dominated by nearly spherical, 200 nm, low-contrast BSE particles, consistent with carbonaceous tar balls. The scale for each micro-image ranges between 0.4 and 9 µm.
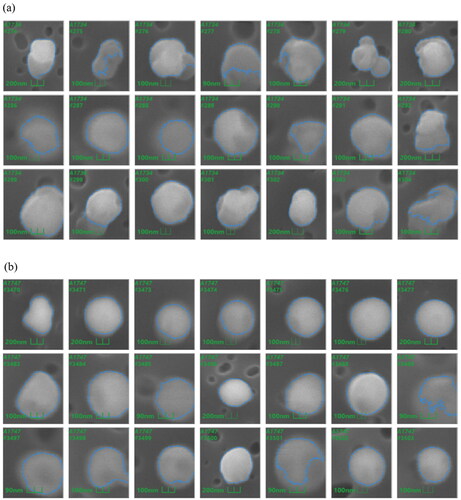
Figure 5. SEM-EDS of carbonaceous combustion PM collected during wildfires in San Rafael. (a) typical 200 nm amorphous spheroid morphology of tar ball from biomass combustion. (b) 20 nm primary particles in rarely observed chain agglomerate, typical of diesel vehicle emissions. (c) 300 nm tar ball CCSEM-EDS spectrum (X-ray counts vs. energy [keV]) with K peak.
![Figure 5. SEM-EDS of carbonaceous combustion PM collected during wildfires in San Rafael. (a) typical 200 nm amorphous spheroid morphology of tar ball from biomass combustion. (b) 20 nm primary particles in rarely observed chain agglomerate, typical of diesel vehicle emissions. (c) 300 nm tar ball CCSEM-EDS spectrum (X-ray counts vs. energy [keV]) with K peak.](/cms/asset/ab363ebd-33fa-4c82-8bd7-d3344391d099/uast_a_1895429_f0005_c.jpg)
Figure 6. 20 kV CCSEM-EDS elemental mass concentration size distributions measured by UNC passive PM samplers (a) outdoors at the same three sites during wildfire and non-wildfire periods. (b) San Rafael wildfire samples from outdoors and indoors.
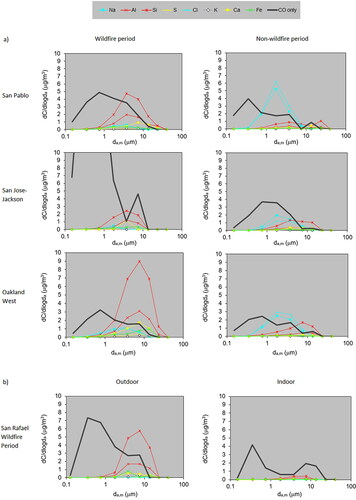
Figure 7. Concentrations of BC and UVPM along with UVPM/BC ratio at the Oakland West site during November 2018. The period of impact from the Camp Fire is shaded in gray. Time resolution is every 2 h.
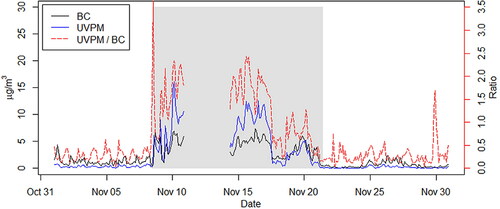
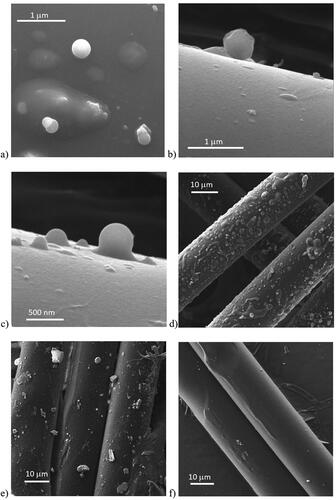
Figure 8. SEM images from San Rafael furnace filters. (a)–(c) Spherical, carbonaceous, submicron tar balls collected during wildfires. (d) Typical fiber surfaces from wildfire filter. (e) Typical fiber surfaces from background filter. (f) Typical fiber surfaces from blank filter.