Figures & data
Table 1. Summary of studies relevant to absorbing aerosols, aerosol single scattering albedo, and relative humidity (RH) dependence.
Figure 1. Experimental flow diagram showing RH controlled cavity attenuated phase shift instrument (H-CAPS-PMSSA). Lower detail shows the interior of the humidifier consisting of a liquid water jacket surrounding the interior aerosol sample flow. Water jacket and aerosol flow are separated by a semi-rigid water-vapor permeable membrane.
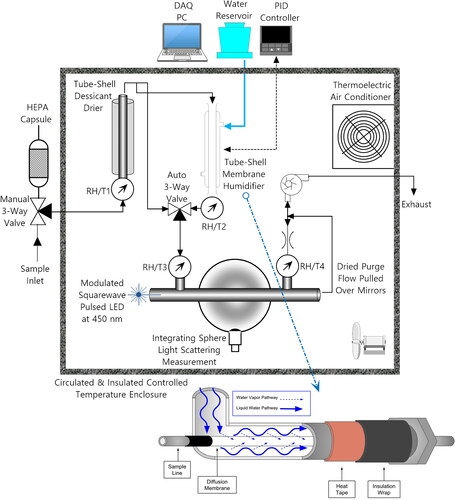
Table 2. Typical profile of RH and temperature through H-CAPS-PMSSA system (arithmetic means and standard deviations of 5-s data averaged over 42 RH scans, n = 22,735).
Figure 2. RH during an RH scan upward as measured immediately upstream and downstream of the CAPS optical cell.
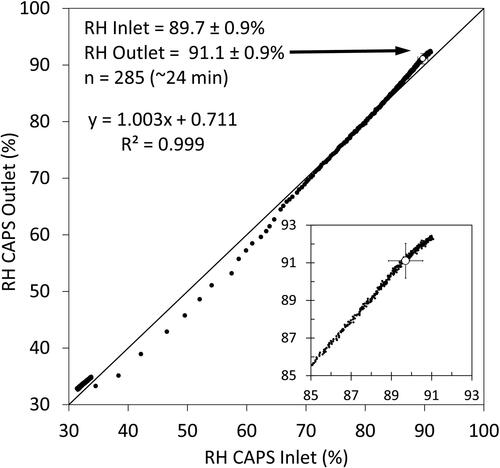
Table 3. Comparison of light extinction, scattering and absorption coefficients (σep, σsp, and σap, respectively) at λ = 450 nm of filtered air at low and high RH (n = 297, 5-s data).
Figure 3. (a) PSL truncation-corrected measured particle loss as a function of diameter (n = 8 from 50 nm < Dp < 1000 nm). Agreement is expressed as ratios of wet to dry extinction and scattering coefficients (with PSL ratio expected as 1.0 due to negligible water uptake). (b) PSL truncation corrected single scattering albedo (SSA) as a function of PSL Dp. Means and standard deviations of ratios of data averaged over ∼5 min (n > = 30) and then ratioed during stable aerosol generation periods. The magnitude of the extinction coefficient for each size is shown as gray bars along the bottom axis where small signals at the extremes of Dp contributed to high variability.
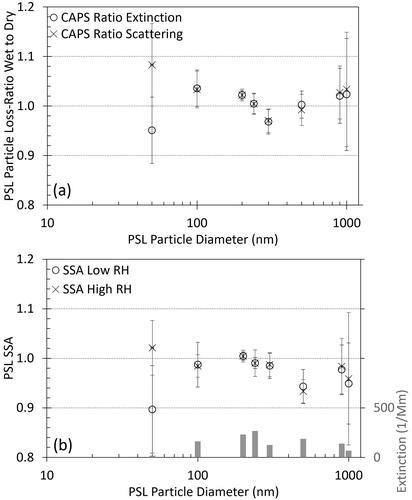
Figure 4. Truncation error effects for CAPS light scattering illustrated by the decrease in uncorrected measured single scattering albedo (SSA) with electrical mobility Dp for a purely scattering ammonium sulfate aerosol.
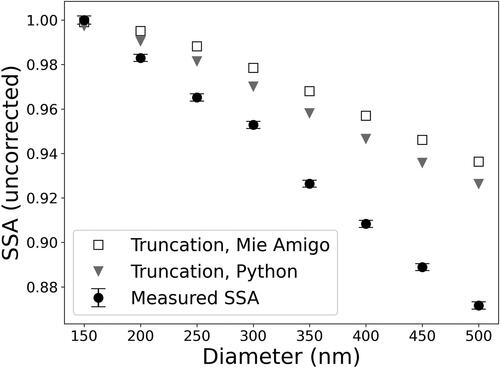
Figure 5. Repeated measurements of light extinction and scattering with deliquesced ammonium sulfate during eight increasing RH scans (∼20% < RH < 85%) in comparison with simulated Mie calculations. The min and max represent calculations with the uncertainties in input parameters (size, concentration, refractive index, diameter growth factors, and RH).
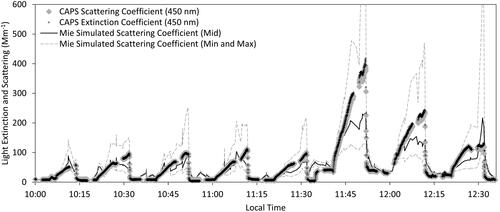
Figure 6. Comparison of f(RH) for light scattering and extinction for pure ammonium sulfate (dry conditions RH < 40%).
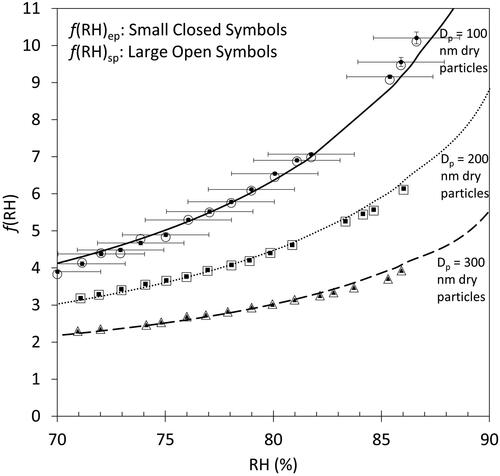
Table 4. Best fit values for optical κep and κsp (averaged for RH > 70%) for pure ammonium sulfate as a function of dry (RH < 40%) size (absorption is negligible).
Table 5. Comparison of values of f(RH)ep for ammonium sulfate.
Figure 7. For dry nigrosin (RH < 40%), the ratio of measured and empirically corrected light absorption for two instruments (CAPS-PMSSA/PASS-3 that uses the ammonium sulfate SSA = 1 calibration via ). The PASS-3 σap at 450 nm was calculated from 405 nm PASS-3 σap and AAE values. The open circles and closed circles show observations made over six months apart after a few updates by different operators to demonstrate stability.
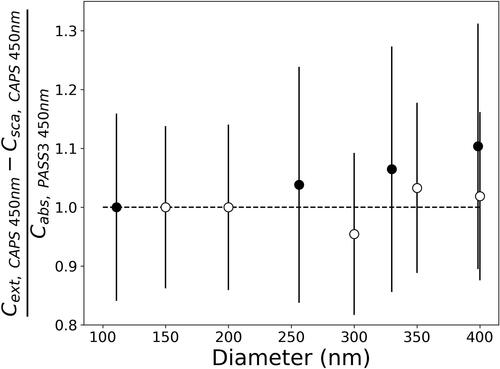
Figure 8. Nigrosin (a) σep, (b) σsp, (c) σap including data from a multi-λ PASS for comparison, and (d) single scattering albedo (SSA) and RH (right y-axis) time series measured with the H-CAPS-PMSSA for twelve RH scans, compared with Mie simulations.
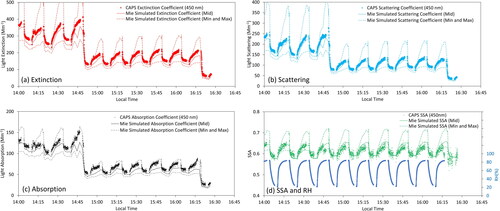
Figure 9. Comparison of f(RH) (where “dry” RH < 40%) for pure nigrosin measured with H-CAPS-PMSSA and corrected for truncation, for (a) σep, (b) σsp, (c) σap, (d) SSA(RH), and (e) f(RH)ap versus f(RH)sp. Representative best fit optical κ-lines are shown for dry Dp = 255 nm. Representative error bars show the standard deviation of the given f(RH) parameter and ±2% RH sensor accuracy.
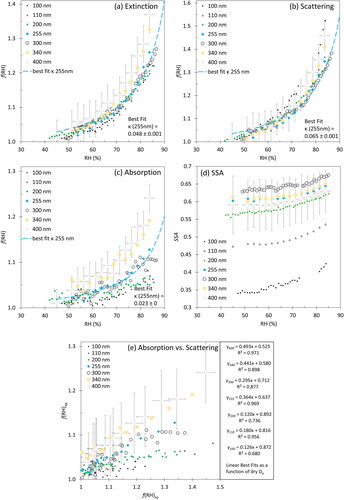
Table 6. Best fit values κ (RH > 80%) for optical parameters for pure nigrosin as a function of dry size.
Table 7. Comparison of values of f(RH) for light absorption for nigrosin.
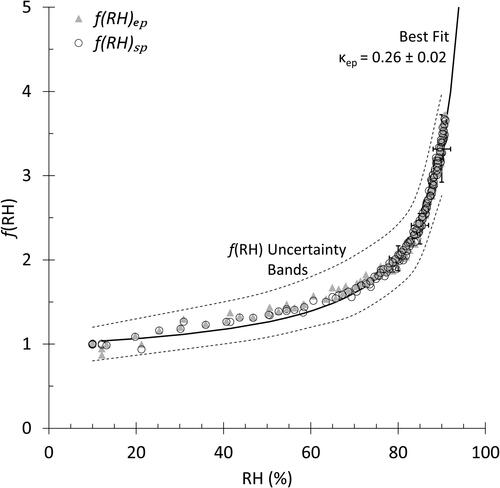
Figure 10. Hygroscopic growth curves f(RH)ep and f(RH)sp for polydispersed pure levoglucosan aerosol generated in the laboratory. σap is negligible for this species. Means and standard deviations over ±2% RH bins are shown at RH = 80%, 85%, and 90%. Dry condition is RH <40%, and best-fit κep curve is shown.