Figures & data
Table 1. Specifications for three tested nanofibrous media.
Table 2. Experimental approach for Chamber Test (CT) and Duct Test (DT).
Figure 1. Schematic diagram of the Chamber Test (CT) apparatus for portable air cleaner media efficiency testing.
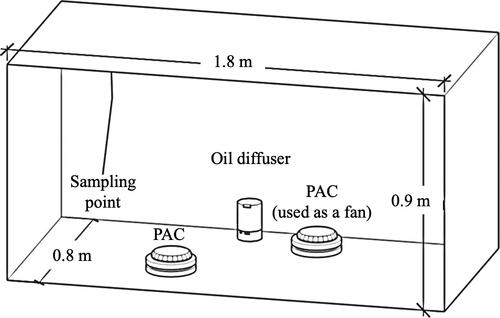
Figure 2. Schematic diagram of the Duct Test (DT) apparatus for media efficiency testing.
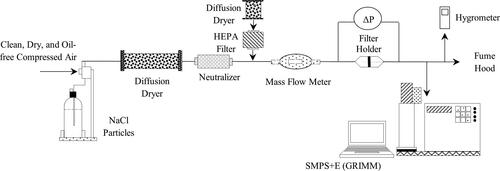
Figure 3. Filtration efficiency of (a) left column: three nanofibrous media in both Chamber Test (CT) and Duct Test (DT), (b) center column: three samples (A, B, C) from each nanofibrous media of M1, M2, M3 in Chamber Test, (c) right column: three samples (a–c) from each nanofibrous media of M1, M2, M3 in Duct Test. ηPM1 is the filtration efficiency based on the monitor-reported mass concentration of >1-micron particles.
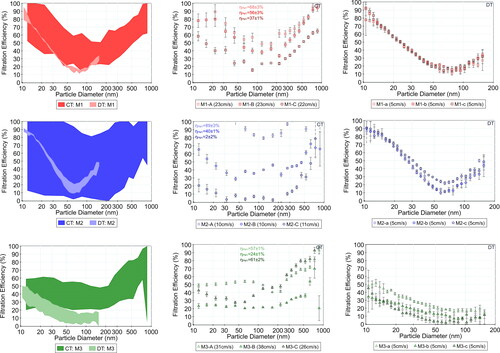
Figure 4. Effects of three months of indoor particle loading (M3-D stands for the initial filter medium and M3-D-l stands for the final medium after long term operation) on filtration efficiency of M3 filter media in Chamber Test (CT). ηƞPM1 is the filtration efficiency based on the monitor-reported mass concentration of >1-micron particles.
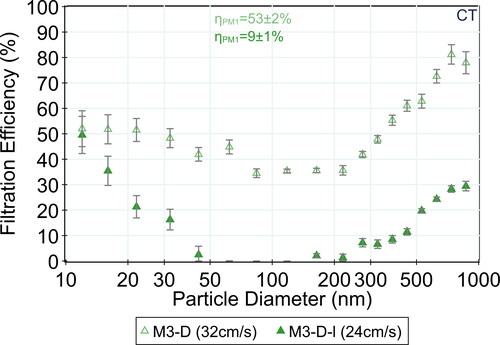
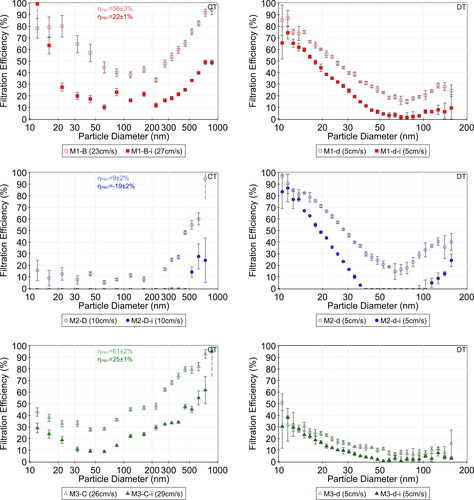
Figure 5. Filtration efficiency of three filter media before and after exposure to IPA (shown with i in legend) for Chamber Test (CT, left column) Duct Test (DT, right column) for three different media samples (rows) ηPM1 is the filtration efficiency based on the monitor-reported mass concentration of >1-micron particles.