
Figures & data
Table 1. Summary of tested sensors in this study.
Figure 1. General experimental set up for decay tests. All sensors were co-located in the same chamber, labeled as “Sensors.” For some experiments, the SMPS was split into a fixed-voltage DMA for size-selection upstream of that chamber and a CPC downstream of the chamber for particle counting.
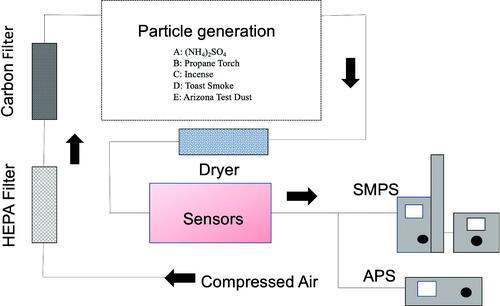
Table 2. Assumed densities for the tested particle sources in this study.
Figure 2. Mean slope and R2 for each particle source for ID5 (PurpleAir II). These data represent the total mass concentration output by the sensors and the total mass concentration inferred from the SMPS + APS (i.e., the values input into the box-and-whisker plot in Figure S3). Error bars represent one standard deviation in both panels.
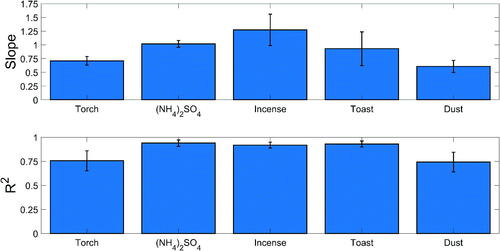
Figure 3. Results for experiments using size-selected propane torch and (NH4)2SO4 particles for ID4 (TSI BlueSky). Bars represent the mean, and error bars represent standard deviation.
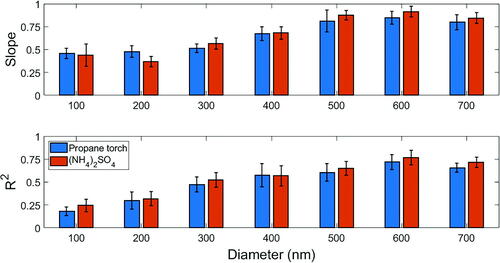
Figure 4. Slope and average R2 for each particle source for ID4 (TSI BlueSky), considering total mass concentration, PM1, PM1–2.5, and PM2.5–10. The size fraction data represent the “as-reported” values from the sensors and the integrated mass concentration within the size range from the SMPS + APS. Bars represent the mean, and error bars represent standard deviation.
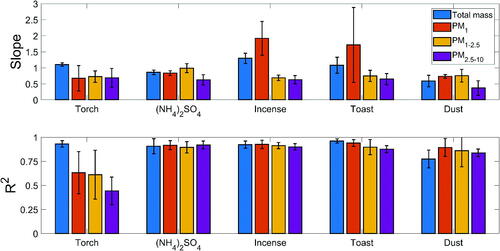
Table 3. Average mass median diameter and geometric standard deviation for all replicates of each particle source tested.