Figures & data
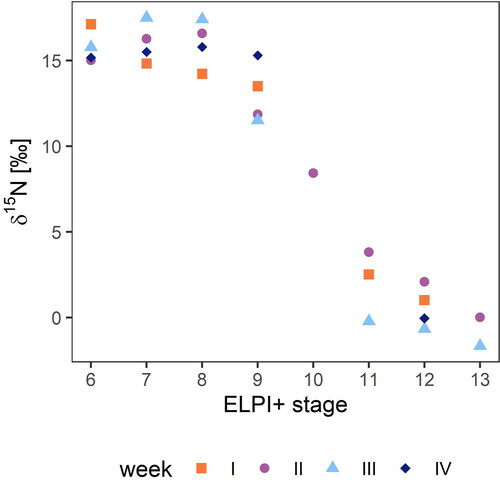
Figure 1. The location of the measurement station in Münster (OpenStreetMap contributors, and the GIS User Community).
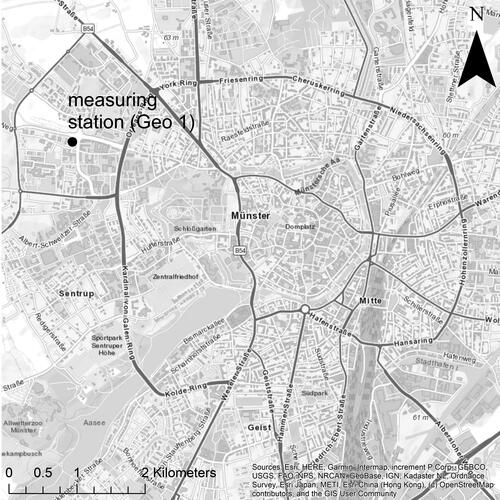
Table 2. ELPI + stages, their 50% lower cutoff size bins and dlogDp multiplier vectors (Dekati Ltd. Citation2015). Median of the particle mass concentration and median of the total ion masses of nitrate, ammonium, chloride and sulfate over the entire measurement period.
Figure 2. Absolute frequency of 10-min intervals of wind directions for each sampling week.
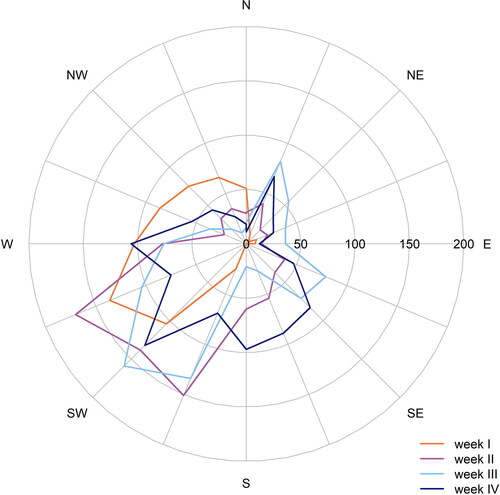
Figure 3. Box and whisker plots of the particle mass concentration over the entire measurement period. Rectangular boxes display the first and third quartiles. The line within each box represents the median value. Whiskers are shown according to Tukey, outliers are excluded.
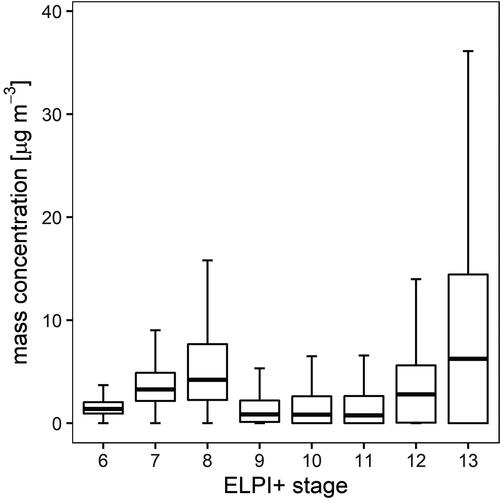
Table 1. Sampling periods and meteorological data obtained on the rooftop of the Geo 1 building of the University of Münster, Germany.
Figure 4. Concentration of cations and anions in the respective sample week. (a) Particulate NH4+; (b) particulate NO3; (c) particulate Cl; (d) particulate SO42-.
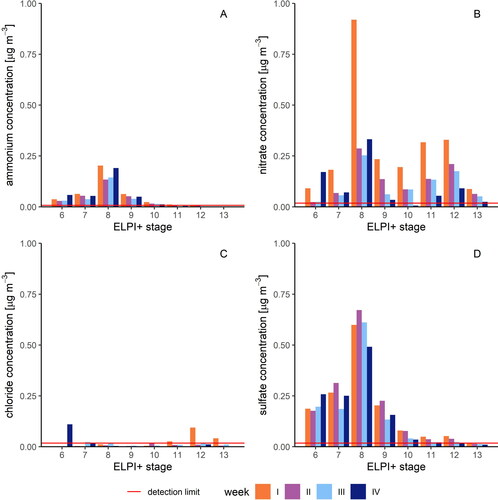
Figure 5. δ15N total nitrogen values for particle samples of each week.