Figures & data
Figure 1. Schematic diagram of the aerosol filter efficiency measurement system. The system consists of a TSI Scanning Mobility Particle Sizer that measures the NaCl aerosol's size distribution with and without a sample mask.
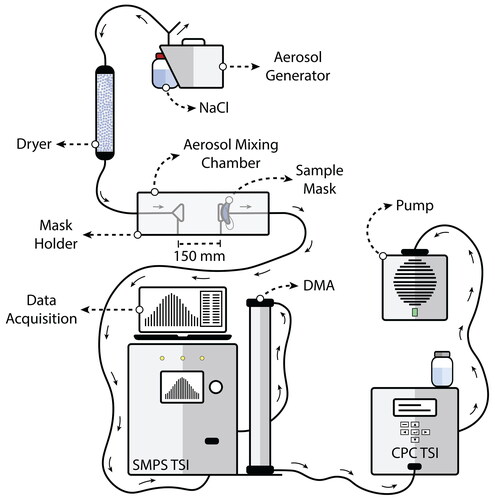
Figure 2. Schematic diagram of the mask breathing resistance. The system consists of a pump, flow meter, sample holder, and U-tube water manometer to measure the differential pressure ΔP.
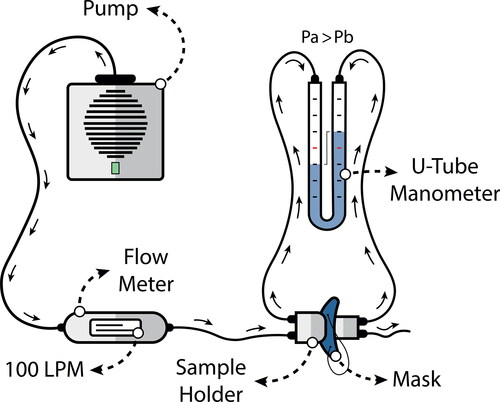
Table 1. Synthesis of all measurements median values for Filtration Efficiency (FE), pressure drop (ΔP), and QF (Quality Factor) for each different group of masks.
Figure 3. Comparison of the median filtering efficiencies in the size interval 60–300 nm for (a) all different masks and fabrics, and (b) different groups of masks: N95 respirators, surgical masks, nonwoven, and cotton-made fabrics. The colors represent the quartiles at 25% and 75% of the median for a specific group.
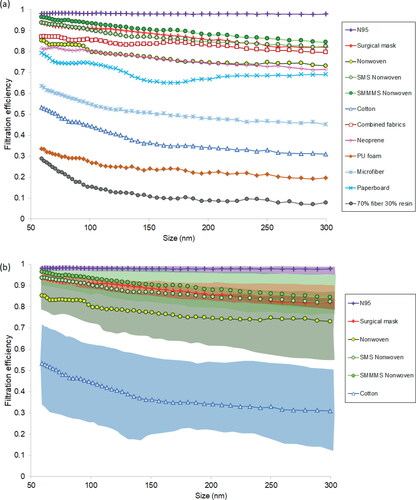
Figure 4. Pressure drop as a function of FE60-300 of all 12 groups of analyzed face masks. The line at a pressure drop of 6 mmH2O/cm2 indicates the WHO maximum recommended value. The line at 0.7 FE60-300 is the recommended WHO minimum FE60-300.
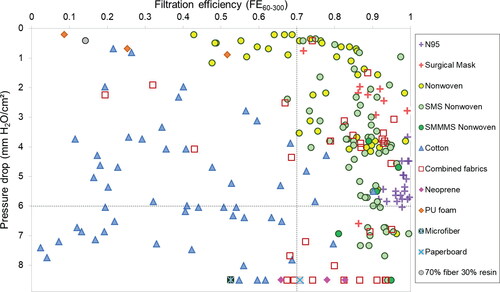
Figure 5. Digital microscopy images showing different fabrics. (a) N95 respirators; (b) surgical mask; (c, d) SMS non-woven; (e) non-woven; (f) cotton with frontal seam; (g) cotton with open weft; (h) cotton with closed weft; (i) cotton with heterogeneous size and voids pattern.
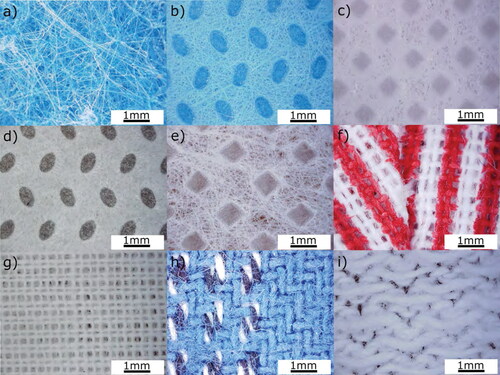
Figure 6. Digital microscopy images of hybrid masks and their respective cross-sections: polyurethane and polyamide (a, d), woven and nonwoven (b, e), nonwoven, and SMS nonwoven (c, f). In cross-section images, fabrics are between glass slides.
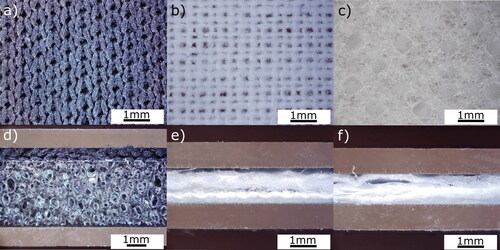
Figure 7. Digital microscopy images of unbreathable masks: (a) nonpermeable nonwoven, (b) paperboard, (c) fabric with a mid-non-permeable layer, and (d) neoprene with dense foams.
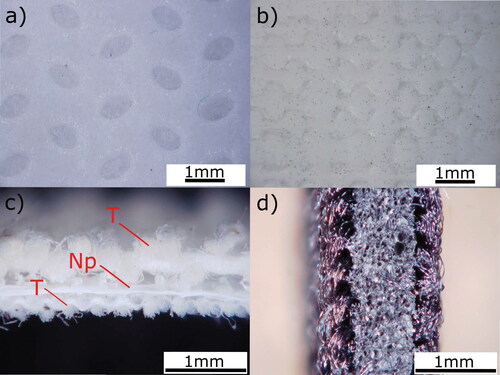
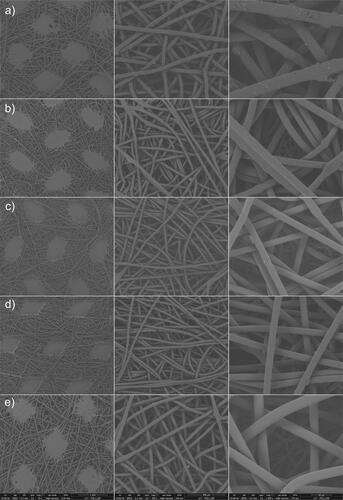
Figure 8. Backscattered electron images of non-woven fabrics: (a) non-woven, (b–d) SMS non-woven and (e) surgical mask. Horizontal field width (HFW) of the images: 3.95 mm in the left column, 920 µm middle column, 276 µm right column.