Figures & data
Figure 1. Human nasal cavity with the olfactory bulb (Patrick J. Lynch, medical illustrator (labeled by was_a_bee). Head olfactory nerve – olfactory bulb en, CC BY 2.5).
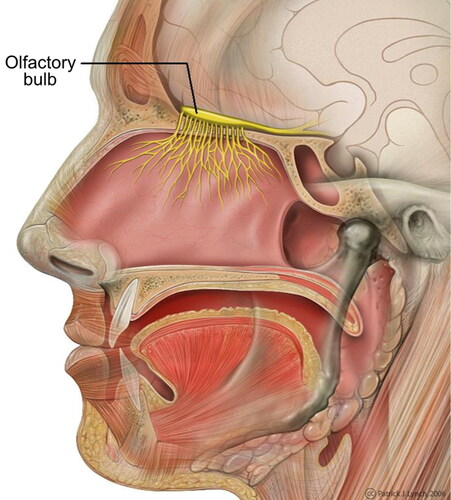
Figure 2. Transport across the blood brain barrier (Wong et al. Citation2019).
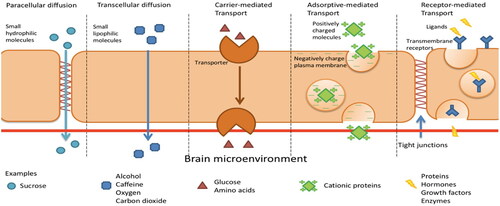
Figure 3. Nasal cavity geometry.
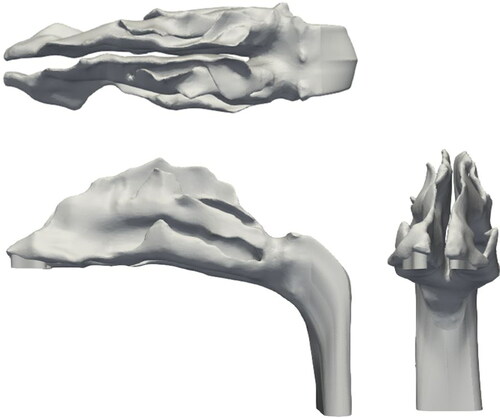
Figure 4. Zoomed in figures of the (a) nasal cavity mesh and (b) mesh slice of a plane of the nasal cavity.
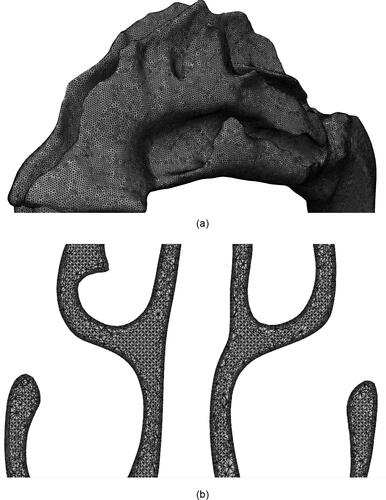
Figure 5. Nasal geometry with the specific regions that will be represented in the Particle Release Map.
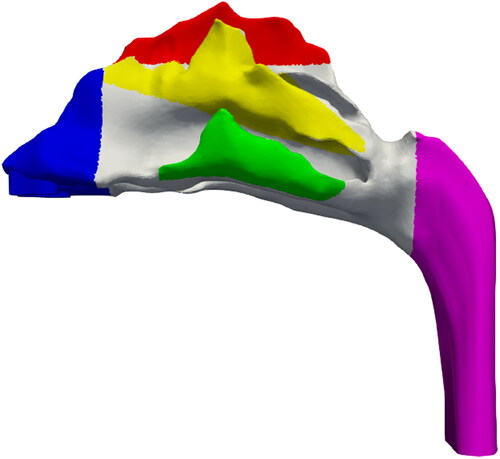
Table 1. Legend correlating the color to the specific region.
Figure 6. Initial injection position of particles, i.e., Normal injection.
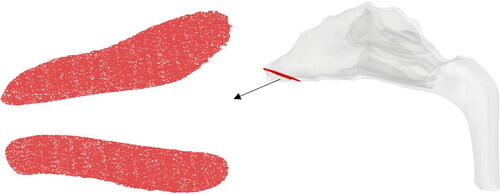
Figure 7. PRM of (a)1 nm, (b) 10 nm, (c) 100 nm, and (d) 500 nm particles for the flowrate of 5 lpm.
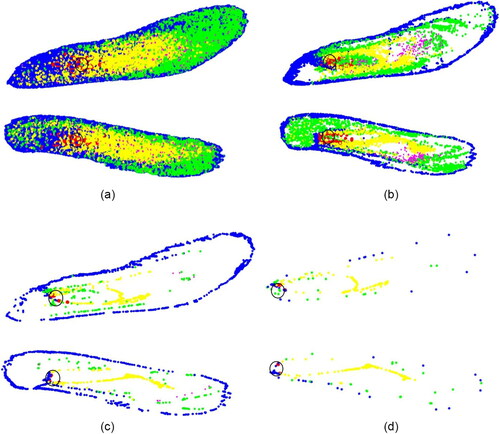
Figure 8. ODE using (a) normal injection and (b) targeted injection for the flowrate of 5 lpm.
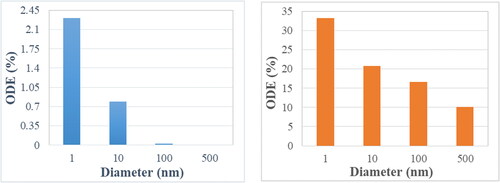
Figure 9. Deposition pattern of 10 nm particles for a flowrate of 5 lpm due to (a) normal injection and (b) targeted injection.
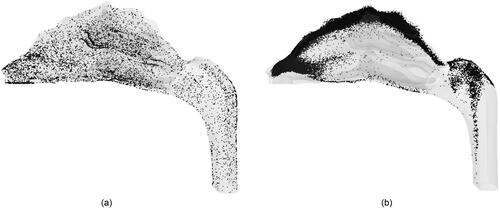
Figure 10. PRM of (a)1 nm, (b) 10 nm, (c) 100 nm, and (d) 500 nm particles for the flowrate of 20 lpm.
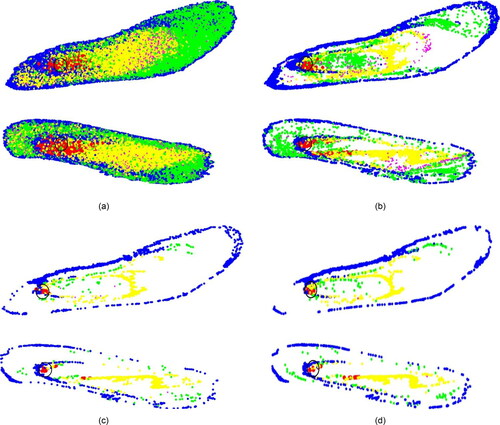
Figure 11. ODE using (a) normal injection and (b) targeted injection for the flowrate of 20 lpm.
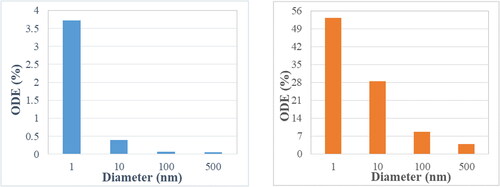
Figure 12. Deposition pattern of 10 nm particles for a flowrate of 20 lpm due to (a) normal injection and (b) targeted injection.
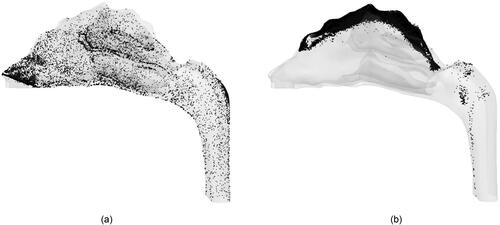
Table 2. Comparison of olfactory deposition efficiency between normal and targeted injection.
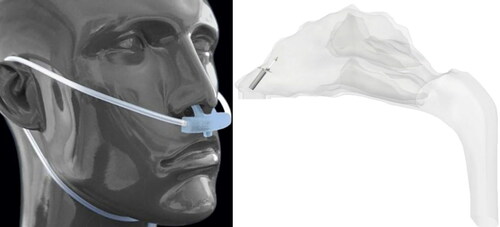
Figure 13. Positioning of the cannula outside (https://www.sharn.com/co2levels/p/CapnoSureEtCO2AdultNasalCannulas/) and inside the nasal cavity.