
Figures & data
Table 1. Summary of airborne dispersion control effectiveness factors.
Table 2. School bus aerosol dispersion and control results.
Figure 1. Placement of the particle counter sensors and the two simulated cough aerosol dispersion locations: (a) school bus, and (b) transit bus. The dual indicators in the aisle represent the floor and ceiling mounted sensors.
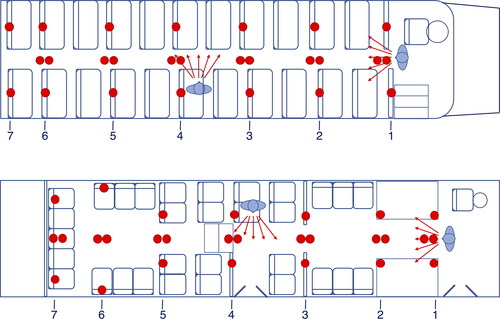
Figure 2. Examples of the measurements performed on the time-series aerosol particle data for a distinguishable aerosol waveform: (a) particle count AUC excluding the noise floor, (b) arrival time, tA, also showing that a 10% threshold time, t10, is never reached after dispersion, and (c) aerosol residence time, tR, at 10% above the noise floor.
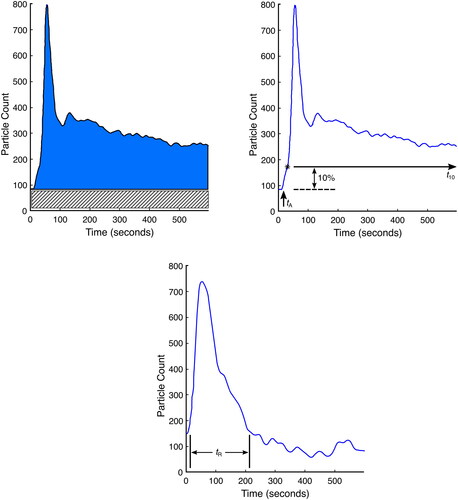
Figure 3. Airflow streamlines from CFD simulation of the low-floor transit bus showing an extremely turbulent air environment. Input parameters and initial airflow measurements were obtained from field test data.
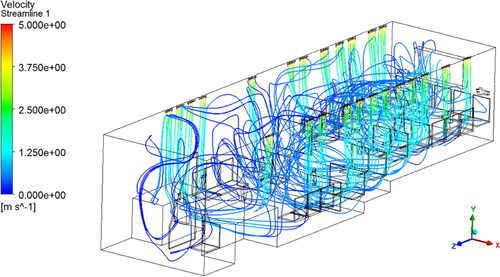
Figure 4. Particle count time-series waveforms from transit bus test with arrows indicating the baseline noise floor (left) and any decreases in aerosol residence (right). (a) shows sensor data from single location with all windows closed. (b) Shows a step function decrease effect when both doors were opened at bus stops.

Table 3. Transit bus aerosol dispersion and control results.
Table 4. Percentile improvements compared to the worst-case scenarios (no-mask, windows closed). Average across all particle diameters.
Supplemental Material
Download MS Word (16.1 MB)Data availability statement
The datasets generated from this study are available to U.S. national, state and regional agencies as well as healthcare systems on request to the corresponding author.