Figures & data
Table 1. Engine conditions performed for each fuel in the order they were performed. Typically, the 9 engine conditions were performed divided on two days.
Table 2. Selected test fuel characteristics.
Figure 1. Schematic of the test setup.
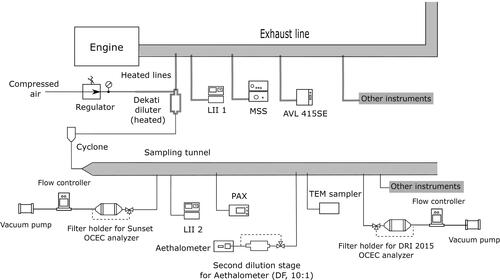
Figure 2. Comparison of the Sunset/EUSAAR 2 and the DRI/IMPROVE A thermal-optical carbon analysis. (a) Total carbon, and (b) elemental carbon with the split point at the helium-oxygen transition forced in most cases (i.e., thermal analysis only). The slopes and intercepts highlighted in bold are not significantly different from 1 and 0, respectively.
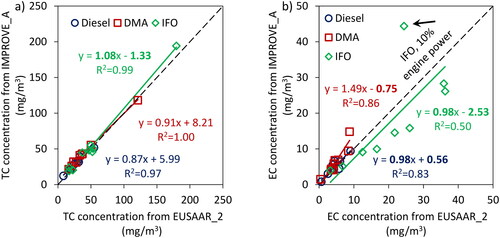
Figure 3. Comparison of different instruments/thermal protocols compared with the average soot concentration as measured with in-line instruments.
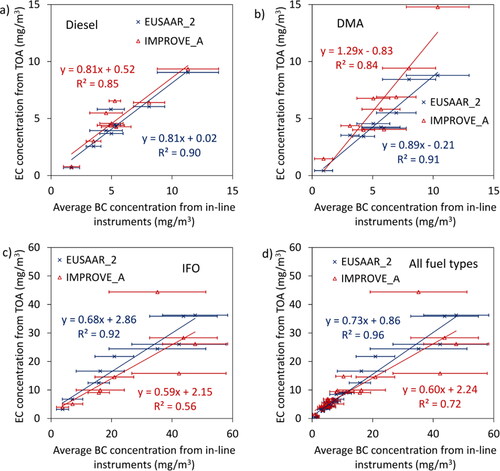
Figure 4. Ratio of BC mass concentrations to average mass concentration for (a) diesel at 1500 rpm, (b) diesel at various engine speeds, (c) DMA at 1500 rpm, (d) DMA at various engine speeds, (e) IFO at 1500 rpm, and (f) IFO at various engine speeds. The gray bars represent the ratio of OC to EC and refer to the left-hand y-axis. The markers represent the ratio of the mass concentration of each instrument to the average of all in-line instruments and refer to the right-hand axis.
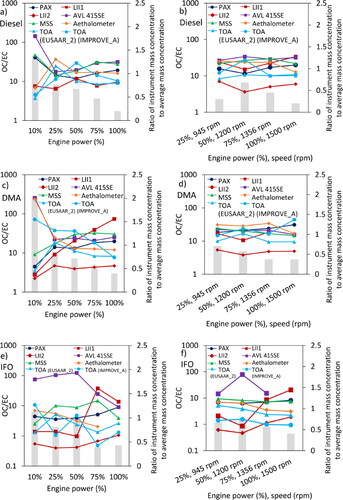
Table 3. Comparison of the results from current study with the results reported by Jiang et al. (Citation2018). For instruments with two lines of numbers, two instruments with the same measurement principle were used for the measurements.
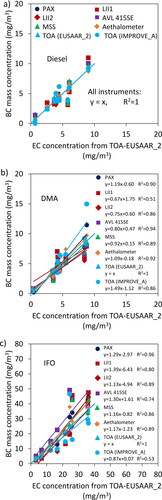
Figure 5. BC concentrations from re-calibrated in-line instruments vs. EC concentrations from TOA (EUSAAR_2).